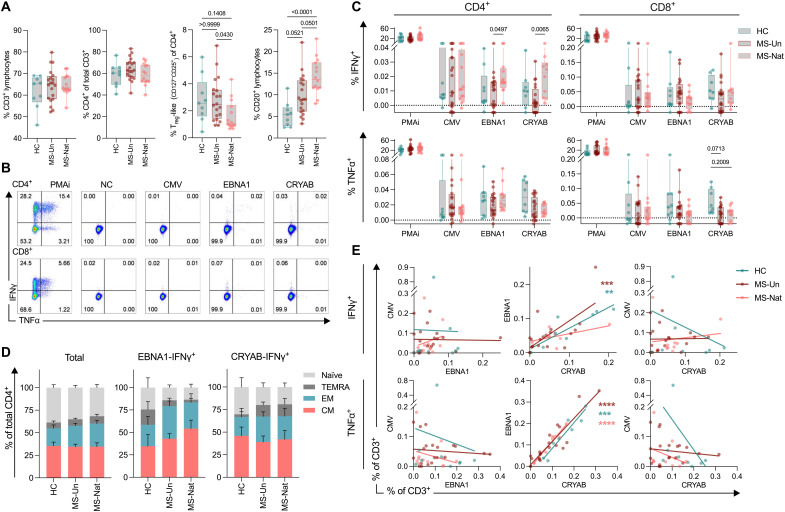
Fig. 5. Characterization of CRYAB-responsive T cells.
Spectral flow cytometry analysis of antigen-stimulated peripheral blood mononuclear cells (PBMCs) in a representative subcohort of the complete PBMC cohort presented in Fig. 4: HC (n = 9), MS-Un (n = 20), and MS-Nat (n = 14). (A) Bulk populations of lymphocyte subsets, based on NB-stimulated cells [negative control (NC) stimulation]. P values were calculated using a Kruskal-Wallis test with Dunn’s correction for multiple comparisons. Treg, regulatory T cell. (B) Representative plots for intracellular cytokine staining (ICS). (C) ICS of antigen bead-stimulated CD4+ and CD8+ T cells. All values presented are individually background adjusted (subtraction of NC-stimulated results). P values were calculated using a two-tailed Mann-Whitney U test with Holm-Sidak correction for multiple comparisons. PMAi, phorbol 12-myristate 13-acetate and ionomycin. (D) Distribution of central memory (CM; CCR7+CD45RA−), effector memory (EM; CCR7−CD45RA−), terminally differentiated EM (TEMRA; CCR7−CD45RA+), and naïve (CCR7+CD45RA+) in the total bulk CD4+ compartment and EBNA1- and CRYAB-responsive IFNγ+ CD4+ T cell compartments. Bars and staples represent the mean and SEM, respectively. Full data are presented in fig. S11. (E) Correlation of IFNγ and tumor necrosis factor α (TNFα) responses to CMV, EBNA1, and CRYAB. Lines and P values denote the linear regression curve. *P < 0.05; **P < 0.01; ***P < 0.001; ****P < 0.0001.

