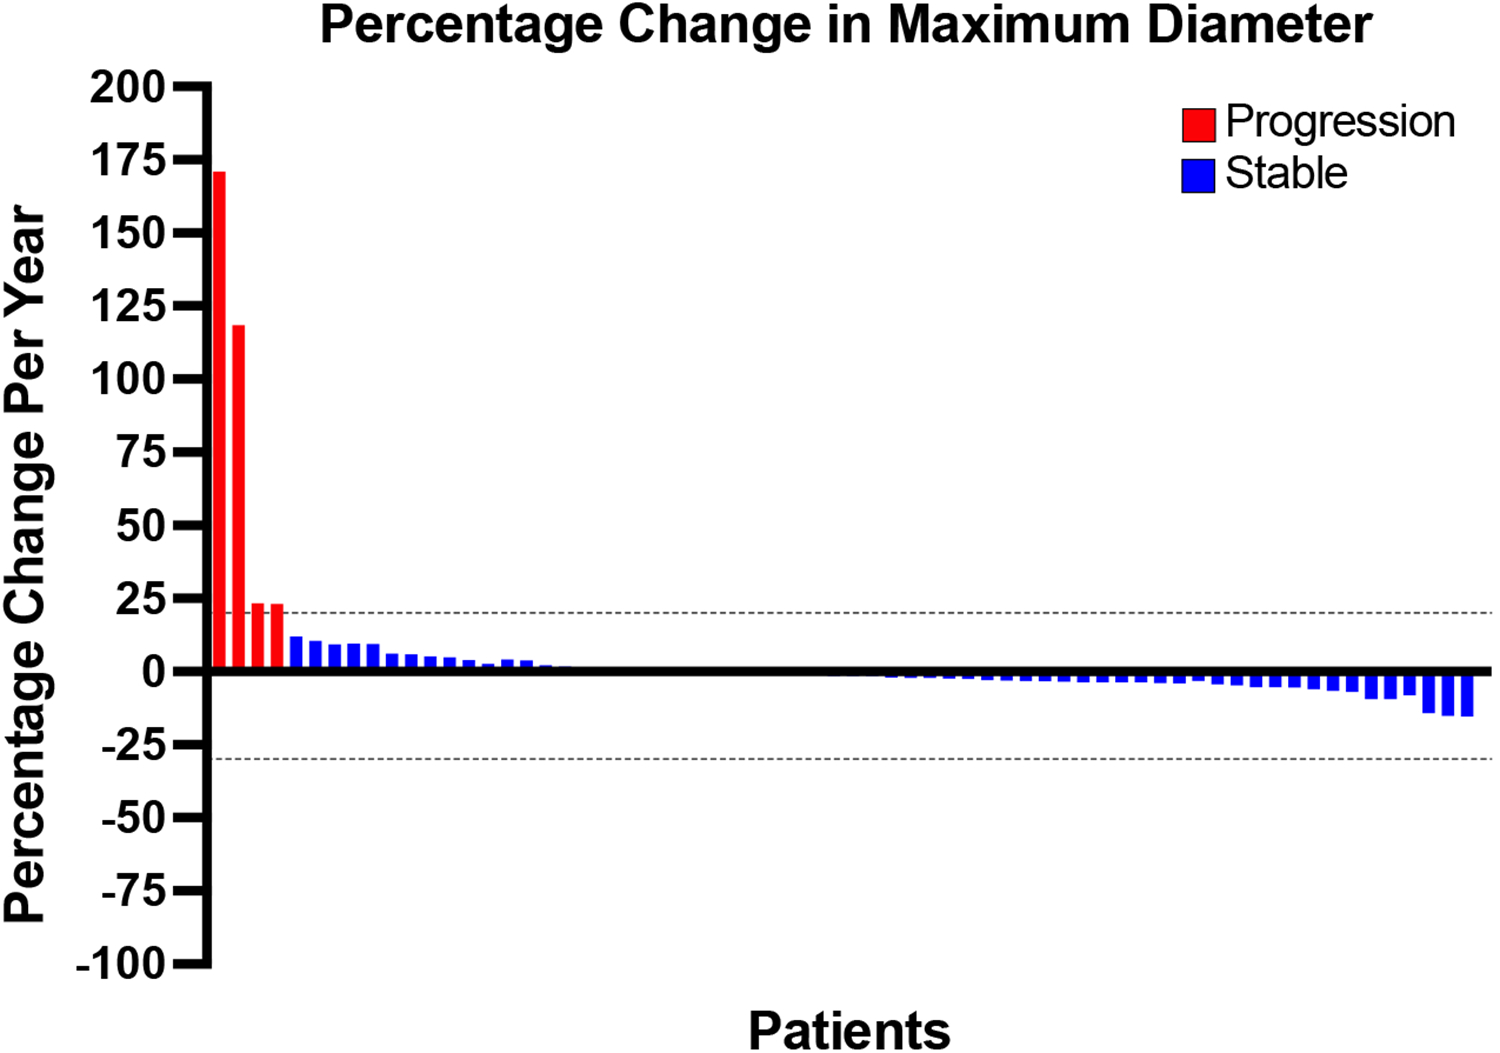
Figure 1:

Percent change in maximum tumor diameter over time. Waterfall plot showing the percent change per year in maximum diameter from baseline to the terminal follow-up scan for each patient. Ganglioneuromas displaying changes greater than 20% were designated as progressive (red) and between 20% and −30% as stable disease (blue).
