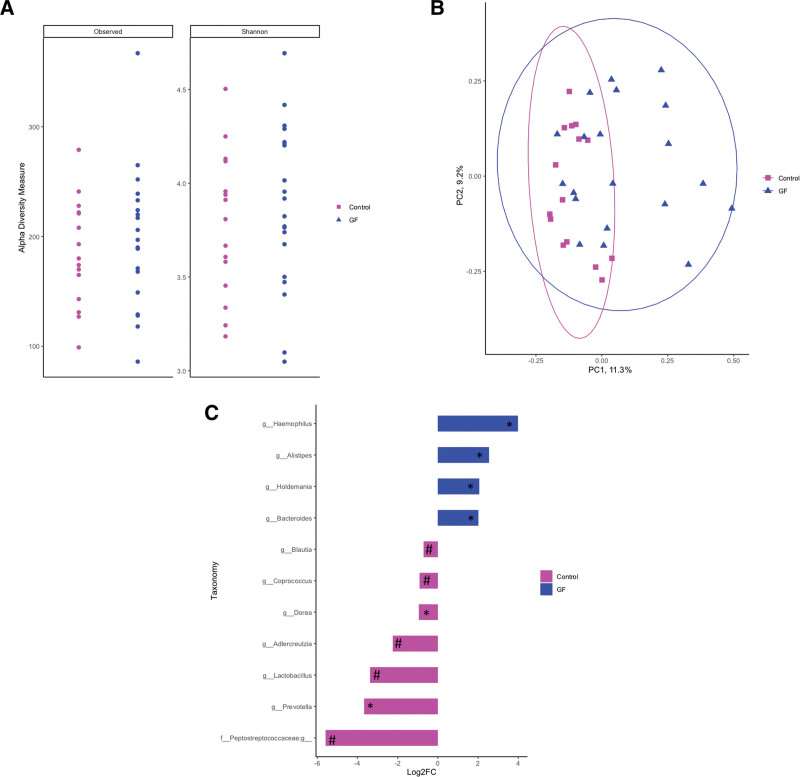
FIGURE 2.
No differences were observed in the diversity of gut-associated microbial communities of healthy controls in comparison to those patients diagnosed with celiac disease after a 1-y GF diet intervention (observed species; P = 0.677 and Shannon index; P = 0.423) (A). However, microbial community structure tended to be different between patients with celiac disease post-GF diet intervention as displayed by a clustering in the principal coordinate analysis using Bray-Curtis dissimilarity (ANOSIM, P = 0.08) (B). C) Taxonomic differences between patients with celiac disease post-GF diet intervention and healthy controls were identified by DeSEQ2. Taxa enriched in healthy controls are shown in pink, whereas taxa enriched in patients with celiac disease after a 1-y GF diet are displayed in blue (*P < 0.05; #P < 0.10). ANOSIM = analysis of similarities; GF = gluten-free; PC = principle coordinate.

