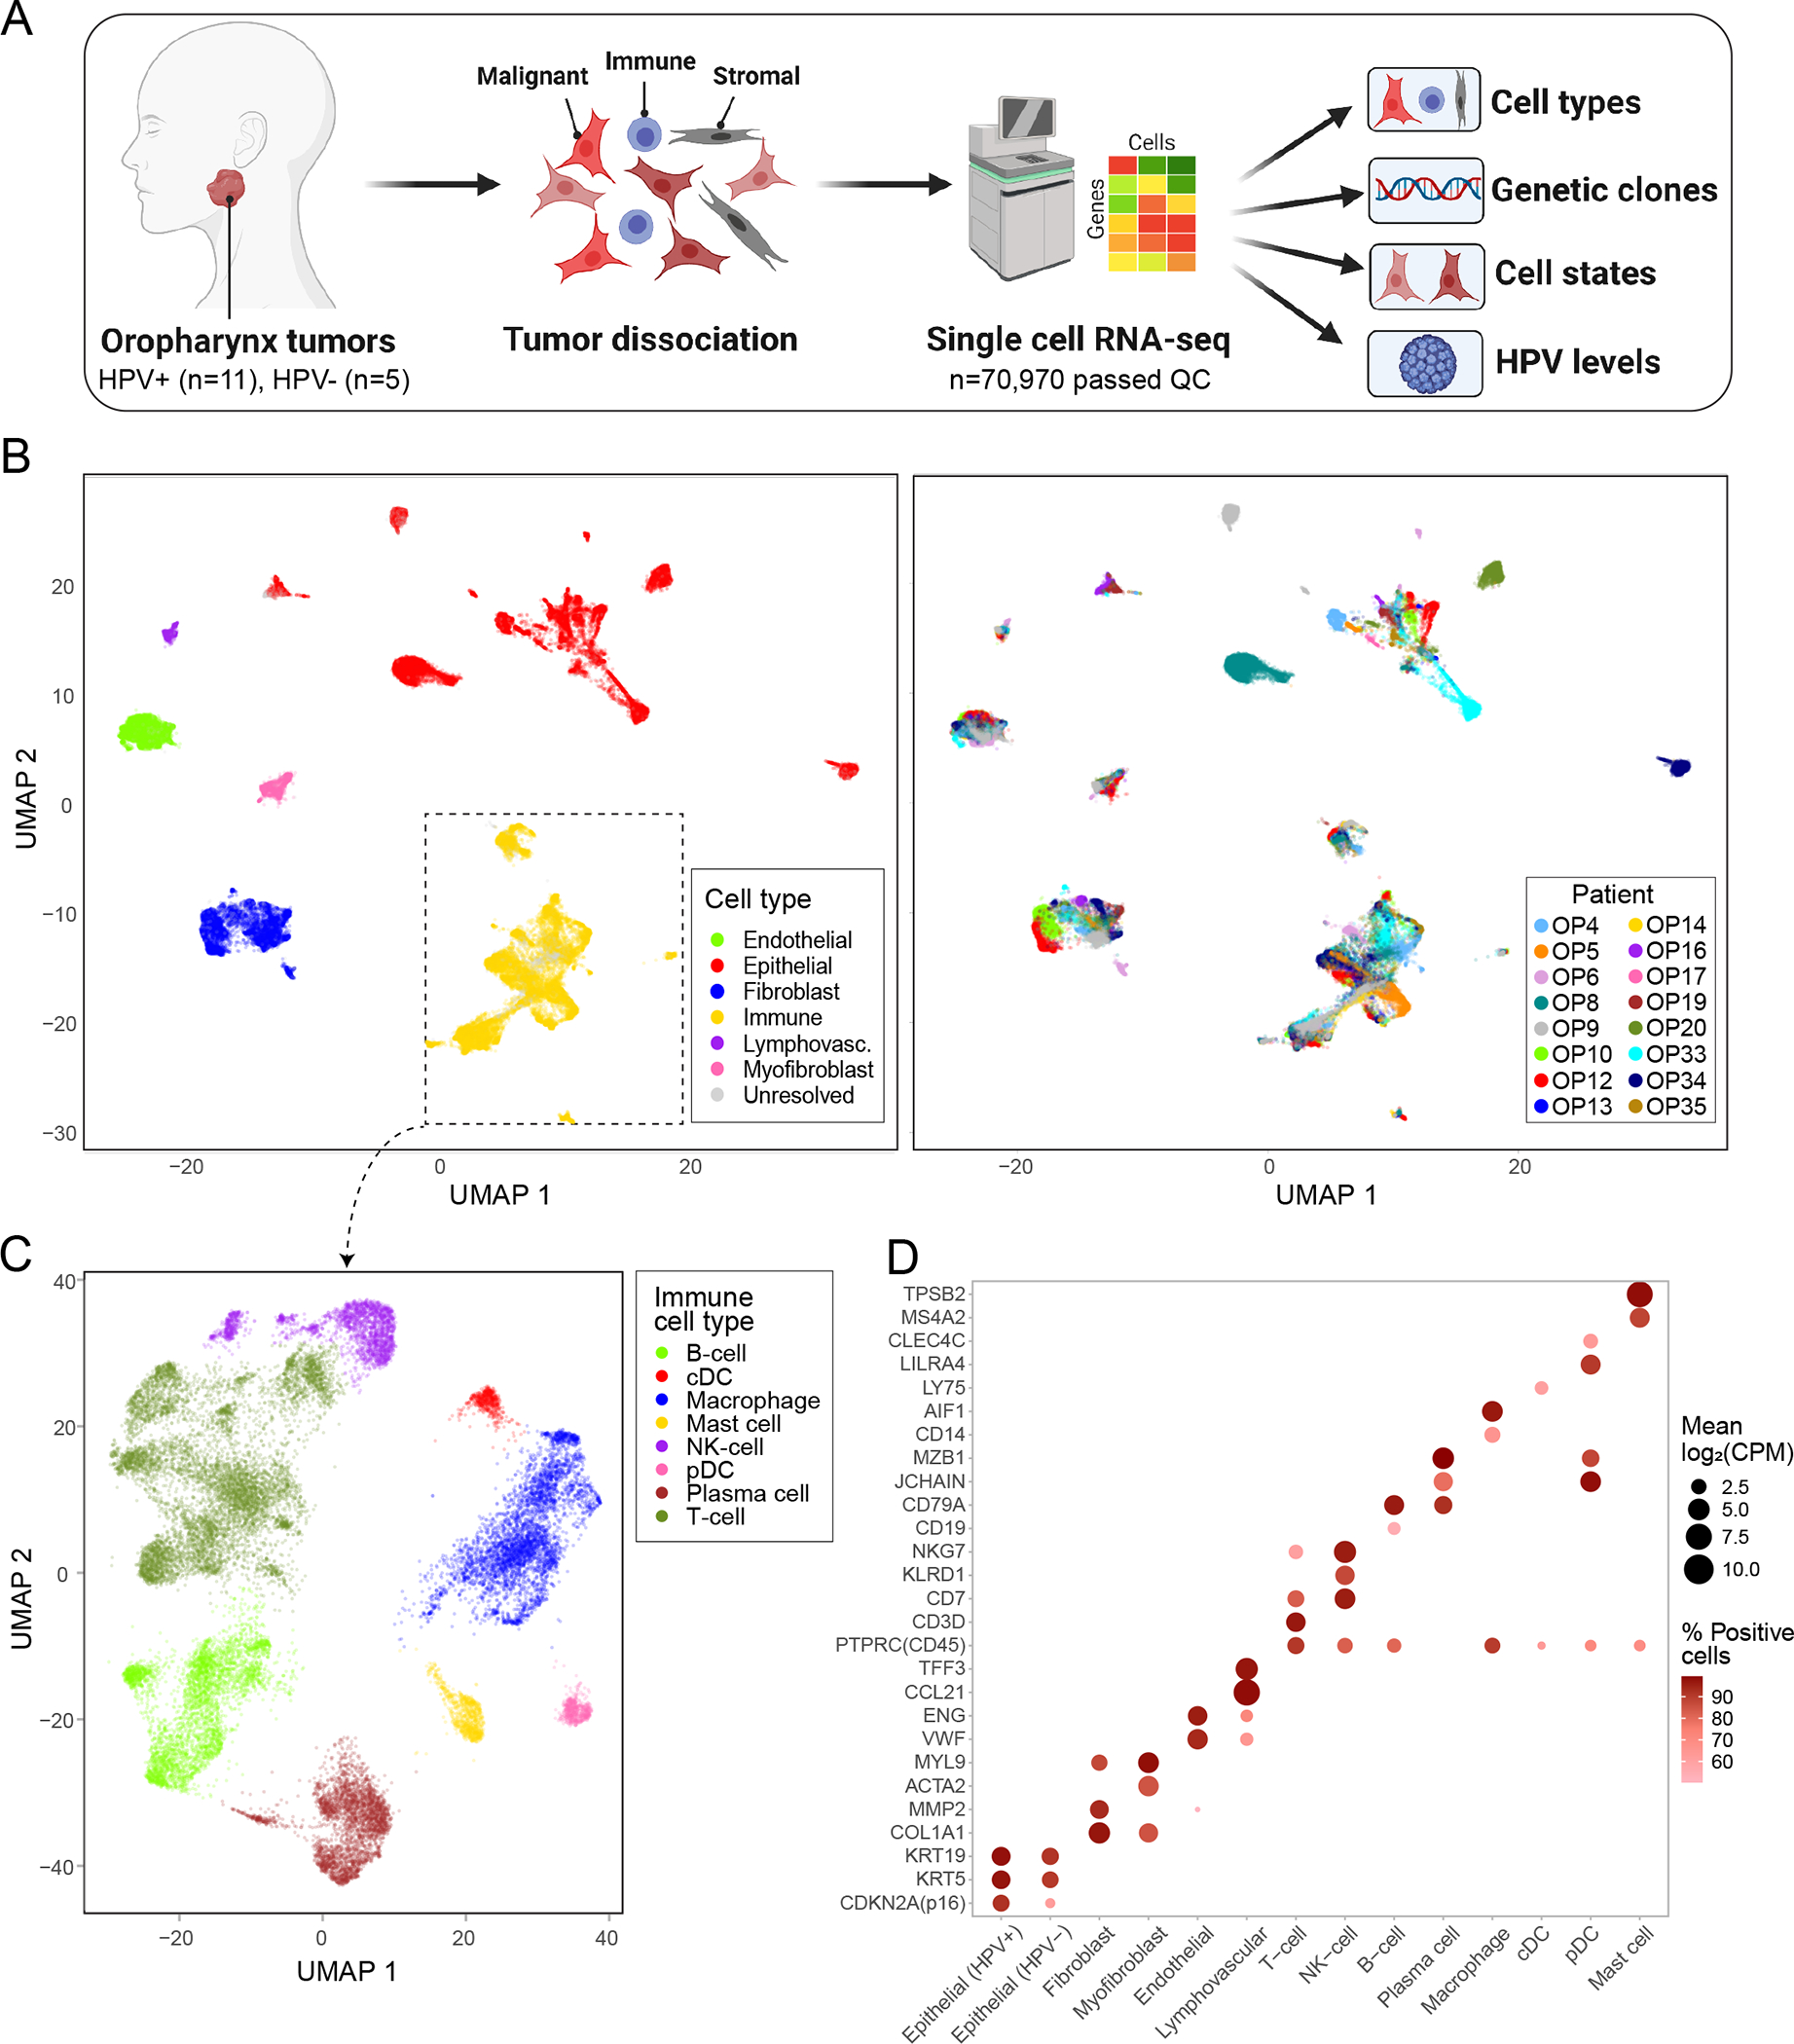
Figure 1. ScRNA-seq analysis of 16 OPSCC tumors.

(A) Scheme of the workflow for OPSCC profiling and subsequent analysis. (B) UMAP plot of all cells that passed QC (n=70,970), colored by cell type and patient. (C) UMAP plot of all immune cells (n=22,818), colored by immune cell type. (D) Dot plot showing expression of selected marker genes (Y-axis) by all cells assigned to each cell type (X-axis). Dot size represents average expression, and dot color represents the fraction of cells with non-zero expression.
