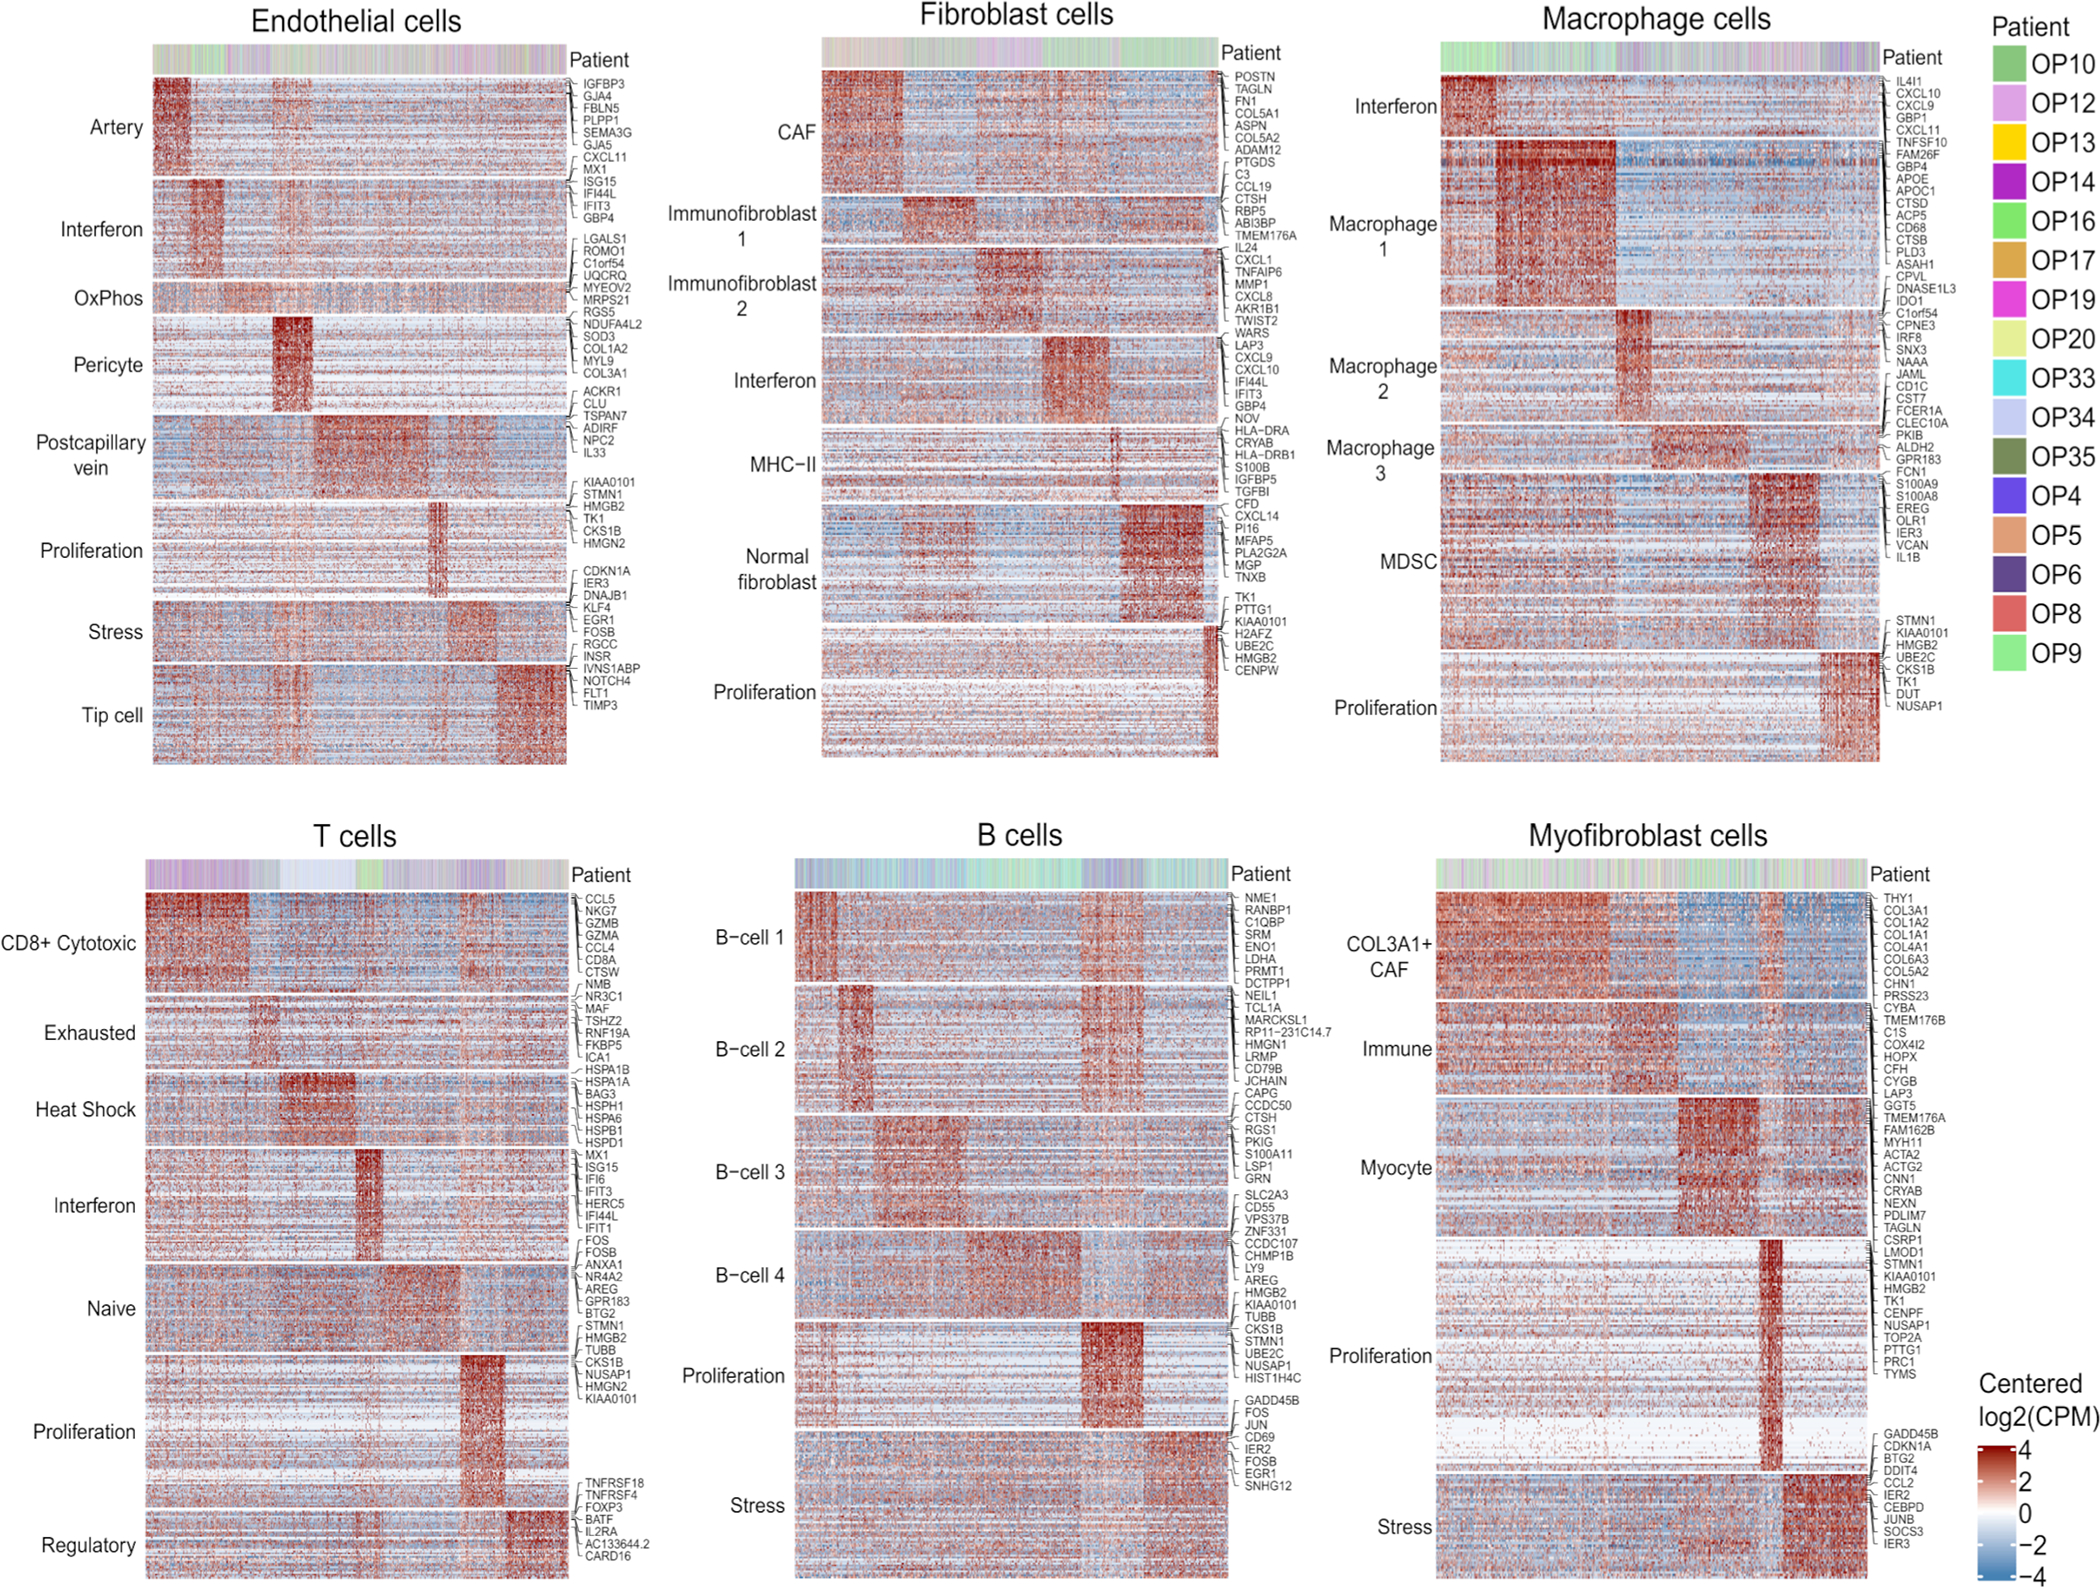
Extended Data Fig. 5. Heterogeneity among common cell types in the OPSCC microenvironment, related to Figure 3.

For each of the common cell types in the OPSCC microenvironment (endothelial cells, fibroblasts, macrophages, T cells, B cells, and myofibroblasts), the corresponding panel shows meta-programs, as defined using the same approach as performed for malignant cells and shown in Fig. 3d. Shown are the relative expression levels of meta-program genes (rows) in all cells of the corresponding cell types (columns). Top panels indicate the patient of origin for all cells.
