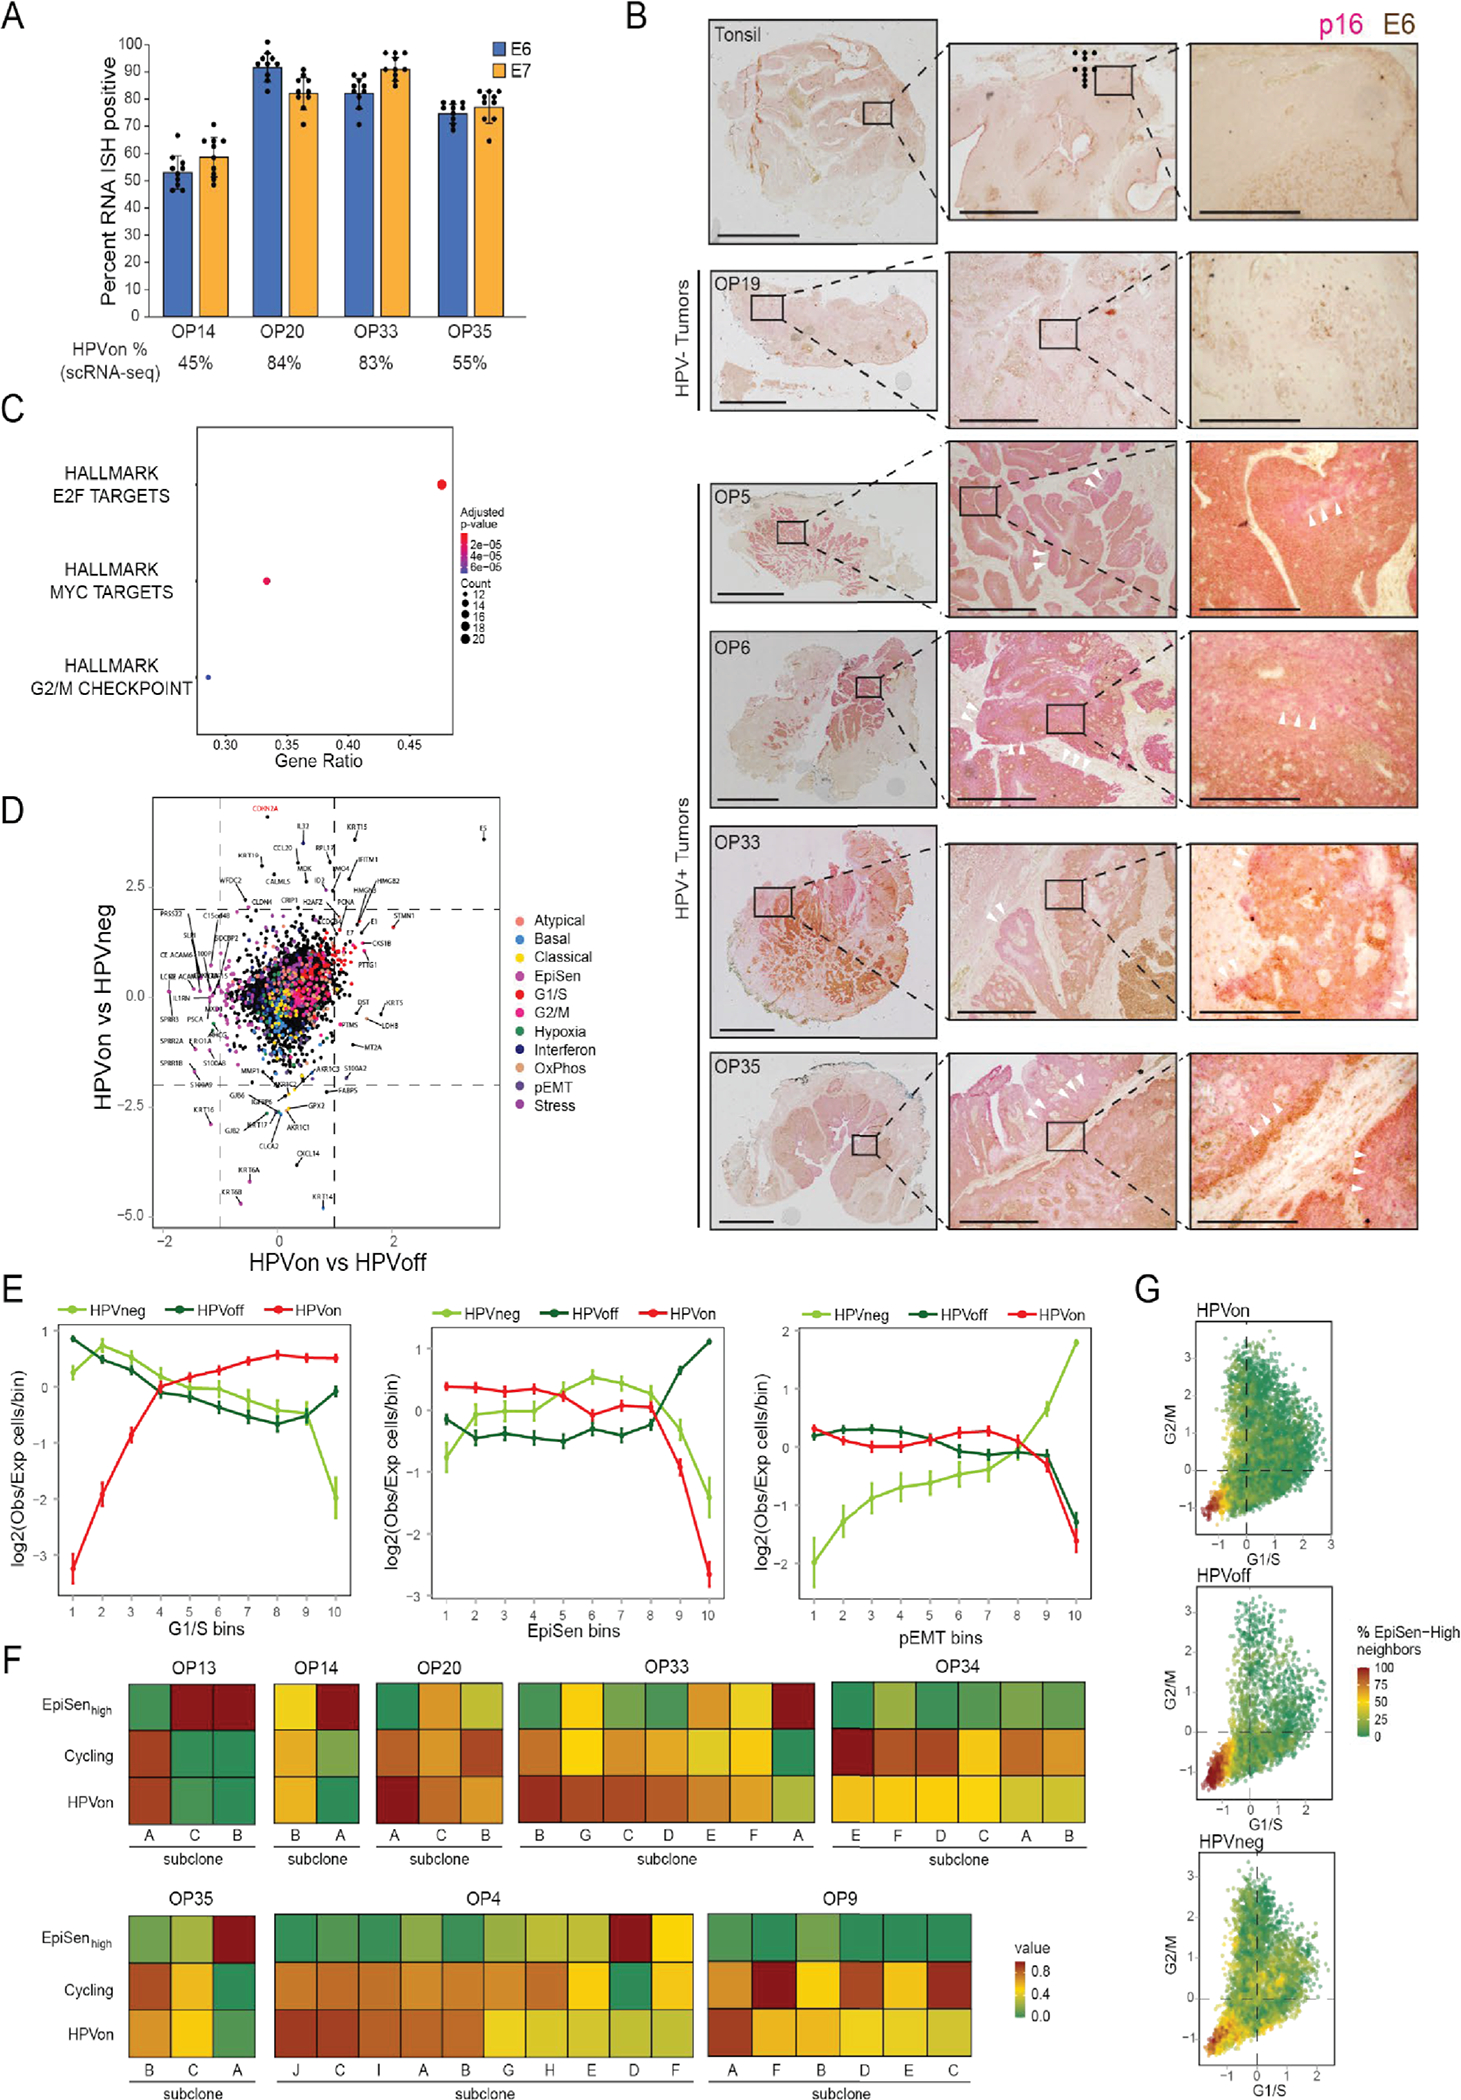
Extended Data Fig. 6. Characteristics of HPVoff cells, related to Figure 4.

(A) Percentage of cells positive for E6 or E7 in RNA ISH analyses (n=4 tumors, shown are mean and standard errora cross nine regions per tumor). Percentage of HPVon cells by scRNA-seq (bottom) correlates with RNA ISH values (p<0.01, ANOVA).
(B) IHC of representative HPV-positive (OP5, OP6, OP33, and OP35) and HPV-negative (OP19) tumors and normal tonsil stained for malignant-cell specific marker p16 (pink) and viral E6 protein (brown). Similar results were obtained in three independent experiments. White arrowheads denote p16 positivity without E6 expression. Scale bars: Low magnification = 10 mm (tonsil, OP5, OP6), 5 mm (OP19), 7.5mm (OP35); intermediate magnification = 1000 μm; highest magnification = 250 μm.
(C) Enriched MSigDB Hallmark gene-sets among genes significantly overexpressed in HPVon versus HPVoff cells. X-axis: fraction of significantly upregulated genes in the gene set.
(D) Differential expression of all analyzed genes between HPV-related classes of malignant cells. X-axis: difference between HPVon and HPVneg cells; Y-axis: difference between HPVon and HPVoff cells, averaged across all HPV-positive patients. Genes are colored by their assignment to meta-program(right legend). CDKN2A (p16, highlighted in red) was not significantly different between HPVon versus HPVoff cells, but was the most overexpressed gene in HPVon cells compared to HPVneg cells.
(E) For three meta-programs (panels), cells were divided into 10 bins of equal size, ranked by average expression from low (left) to high (right). Y-axis: mean ratio of cells belonging to an HPV subset versus the expected number assuming random distribution across bins. Error bars reflect SEM based on 100 re-sampling runs (n=5 patients for HPVneg, n=11 patients for HPVon and HPVoff). P-values are based on chi-square test.
(F) Fractions of cycling cells, EpiSen-high cells and HPVon cells across genetic subclones. Subclones with a high fraction of HPVon cells tend to also have higher proliferation (p<0.05 for correlations in OP13, OP33 and OP35).
(G) G1/S (X-axis) and G2/M (Y-axis) scores of all malignant cells, colored by the percentage of cycling cells among their neighbors (20 closest cells in this plot).
