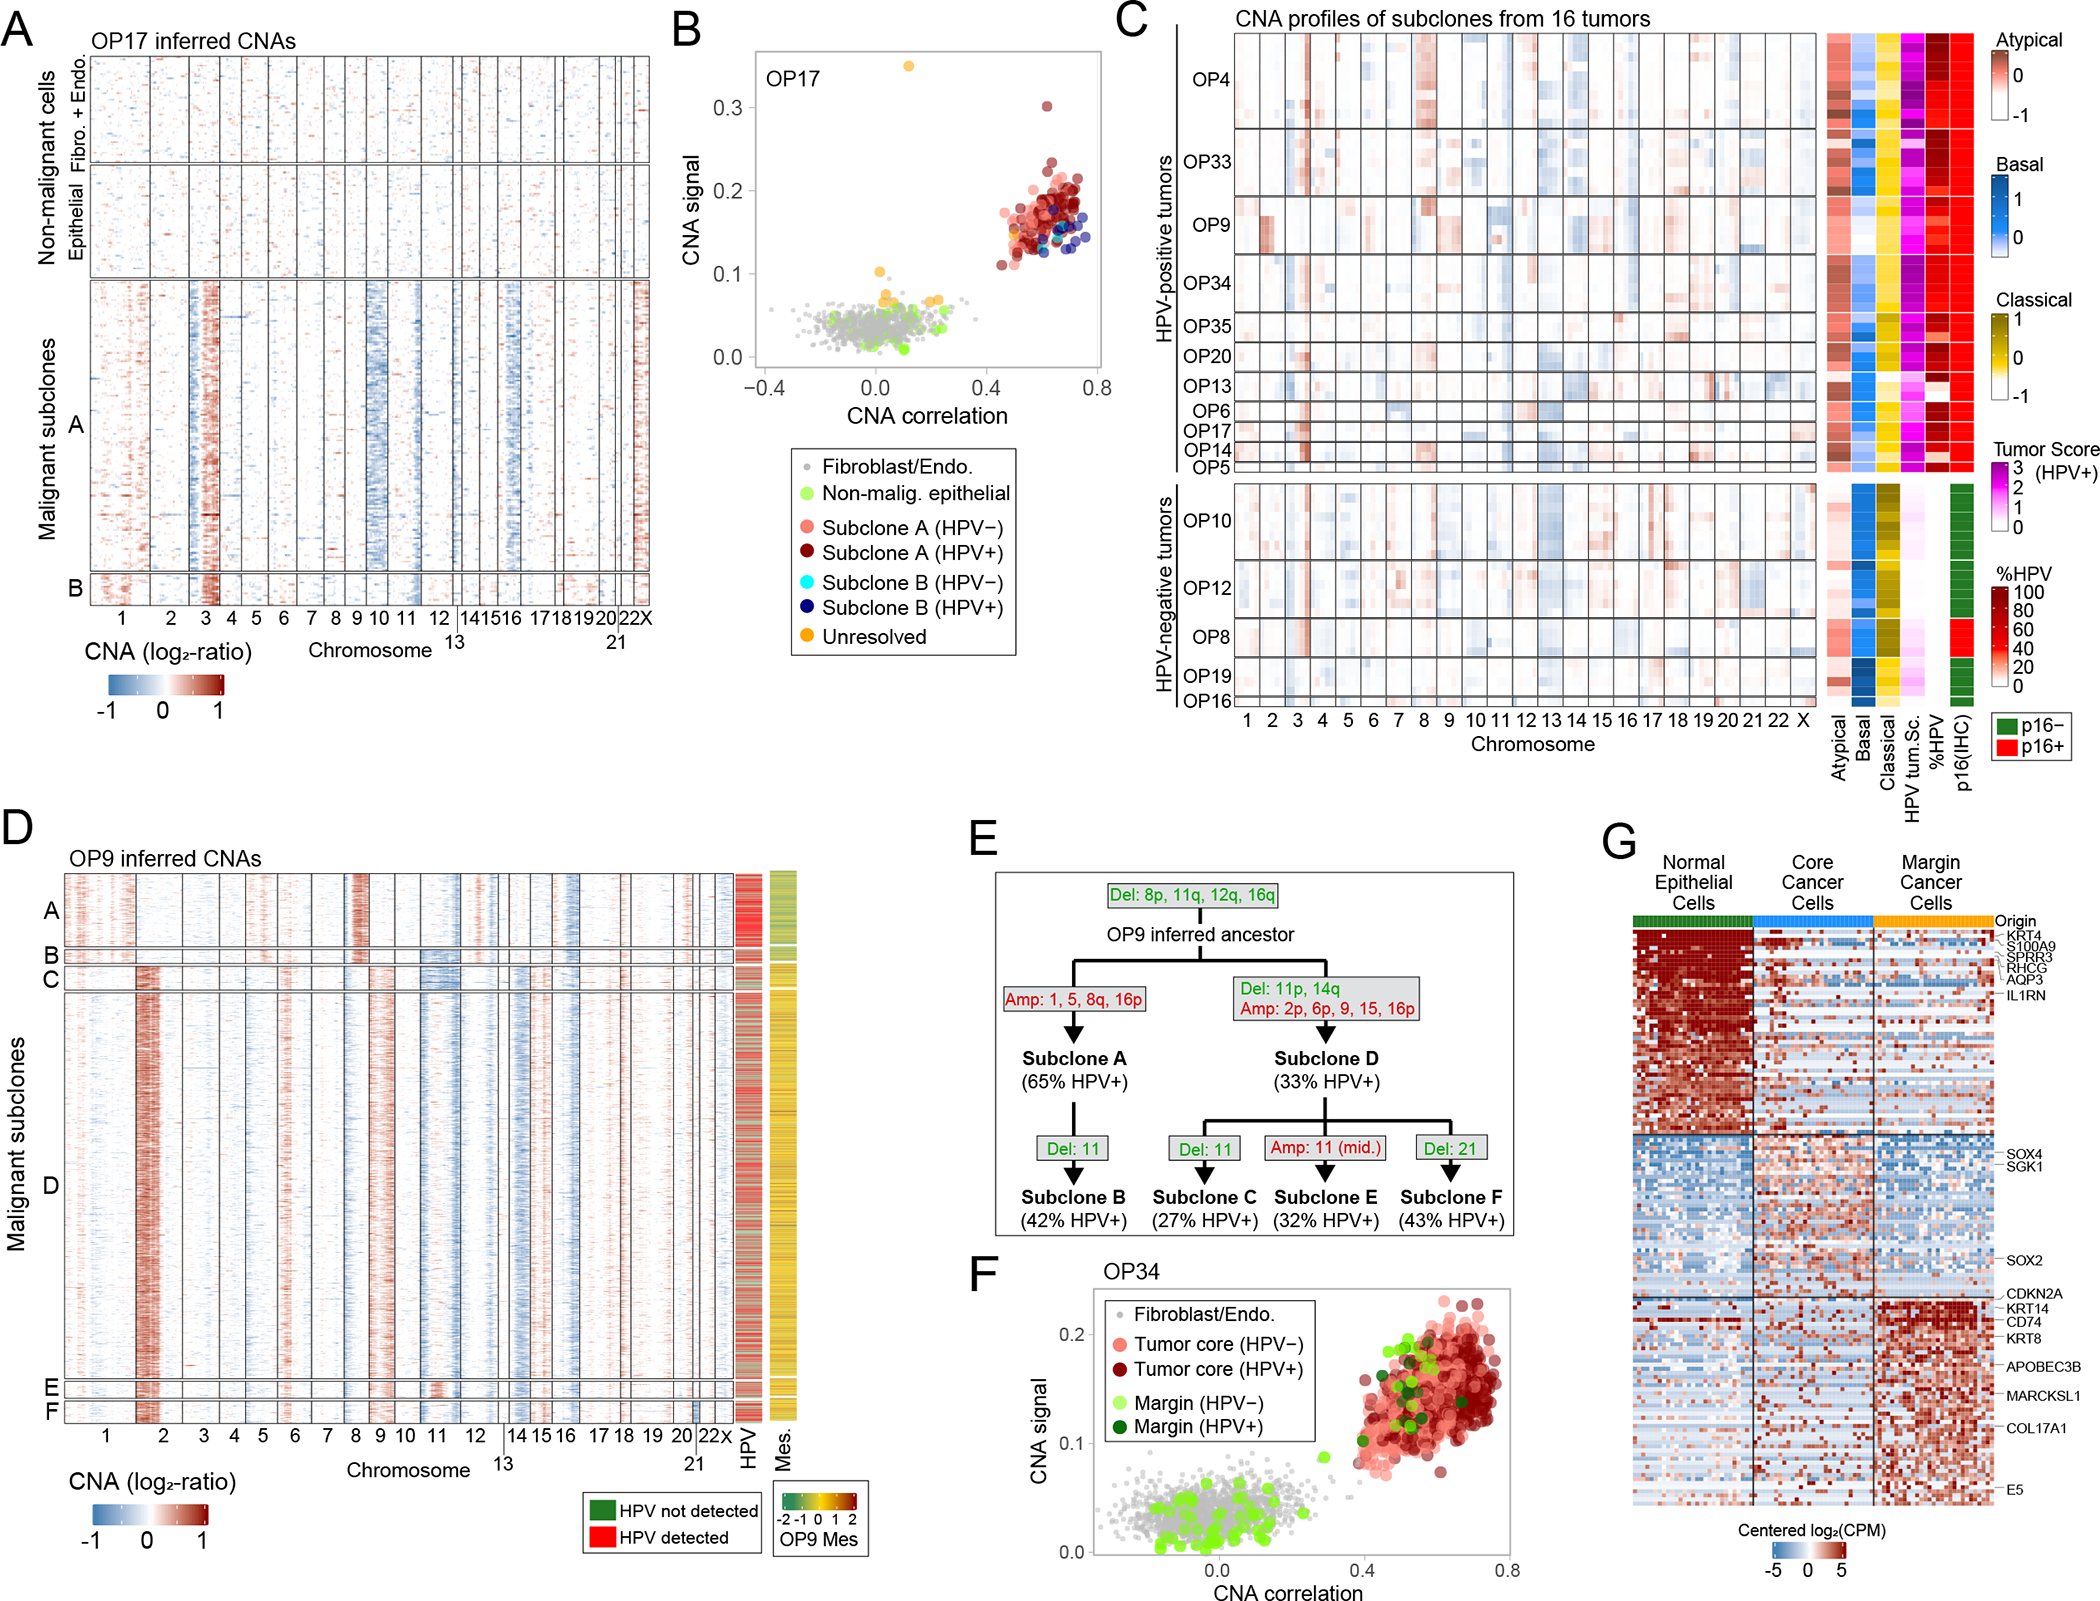
Figure 2. Inference of chromosomal aberrations for identification of malignant cells, genetic subclones and invasive cells.

(A) CNA plot of OP17, inferred through taking a 100-gene moving average of relative expression values across the transcriptome (Methods). Rows represent cells, arranged by genetic subclones, and columns genes, arranged by chromosomal position. Fibroblasts and endothelial cells, used as reference for CNA inference, as well as cells classified as non-malignant epithelial cells, are shown above the malignant cells. (B) Scatter plot of two CNA metrics used for classification of cells as malignant, CNA signal (Y-axis) and CNA correlation (X-axis). All epithelial and stromal cells of OP17 are shown, colored by their cell type, subclone assignment and HPV expression. (C) Left: average CNA profiles for all identified genetic subclones; rows represent subclones, ordered by patient, and columns represent chromosomal positions (with five bins per chromosome). Right: scores of subclones (arranged as in left panel) for the TCGA subtypes and the HPV+ tumor signatures, the percentage of cells with HPV reads, and the HPV clinical classification of the corresponding tumor based on p16 staining. Subclone scores reflect average scores of the cells in each subclone. (D) CNA plot of malignant cells in OP9 as in (A). Columns on the right show detection of HPV reads and average expression of a mesenchymal signature found in OP9. (E) Inferred phylogenetic tree of genetic subclones in OP9. The percentage of cells with detection of HPV reads is noted for each observed subclone; chromosomal deletions (green) and amplifications (red) are noted for each observed subclone as well as for the inferred ancestral clone. (F) CNA signal and correlation scatter plot for OP34 as in (B). Cells are colored by their origin (tumor core or margin sample) and by HPV expression. (G) Heatmap of differentially expressed genes between the three subsets of epithelial cell in OP34 – normal epithelial cells, invasive malignant cells and malignant cells from the tumor core. Rows represent genes, columns represent cells. An equal number of cells is shown from each subset (to that end, cells from the normal and tumor core subsets were randomly sampled).
