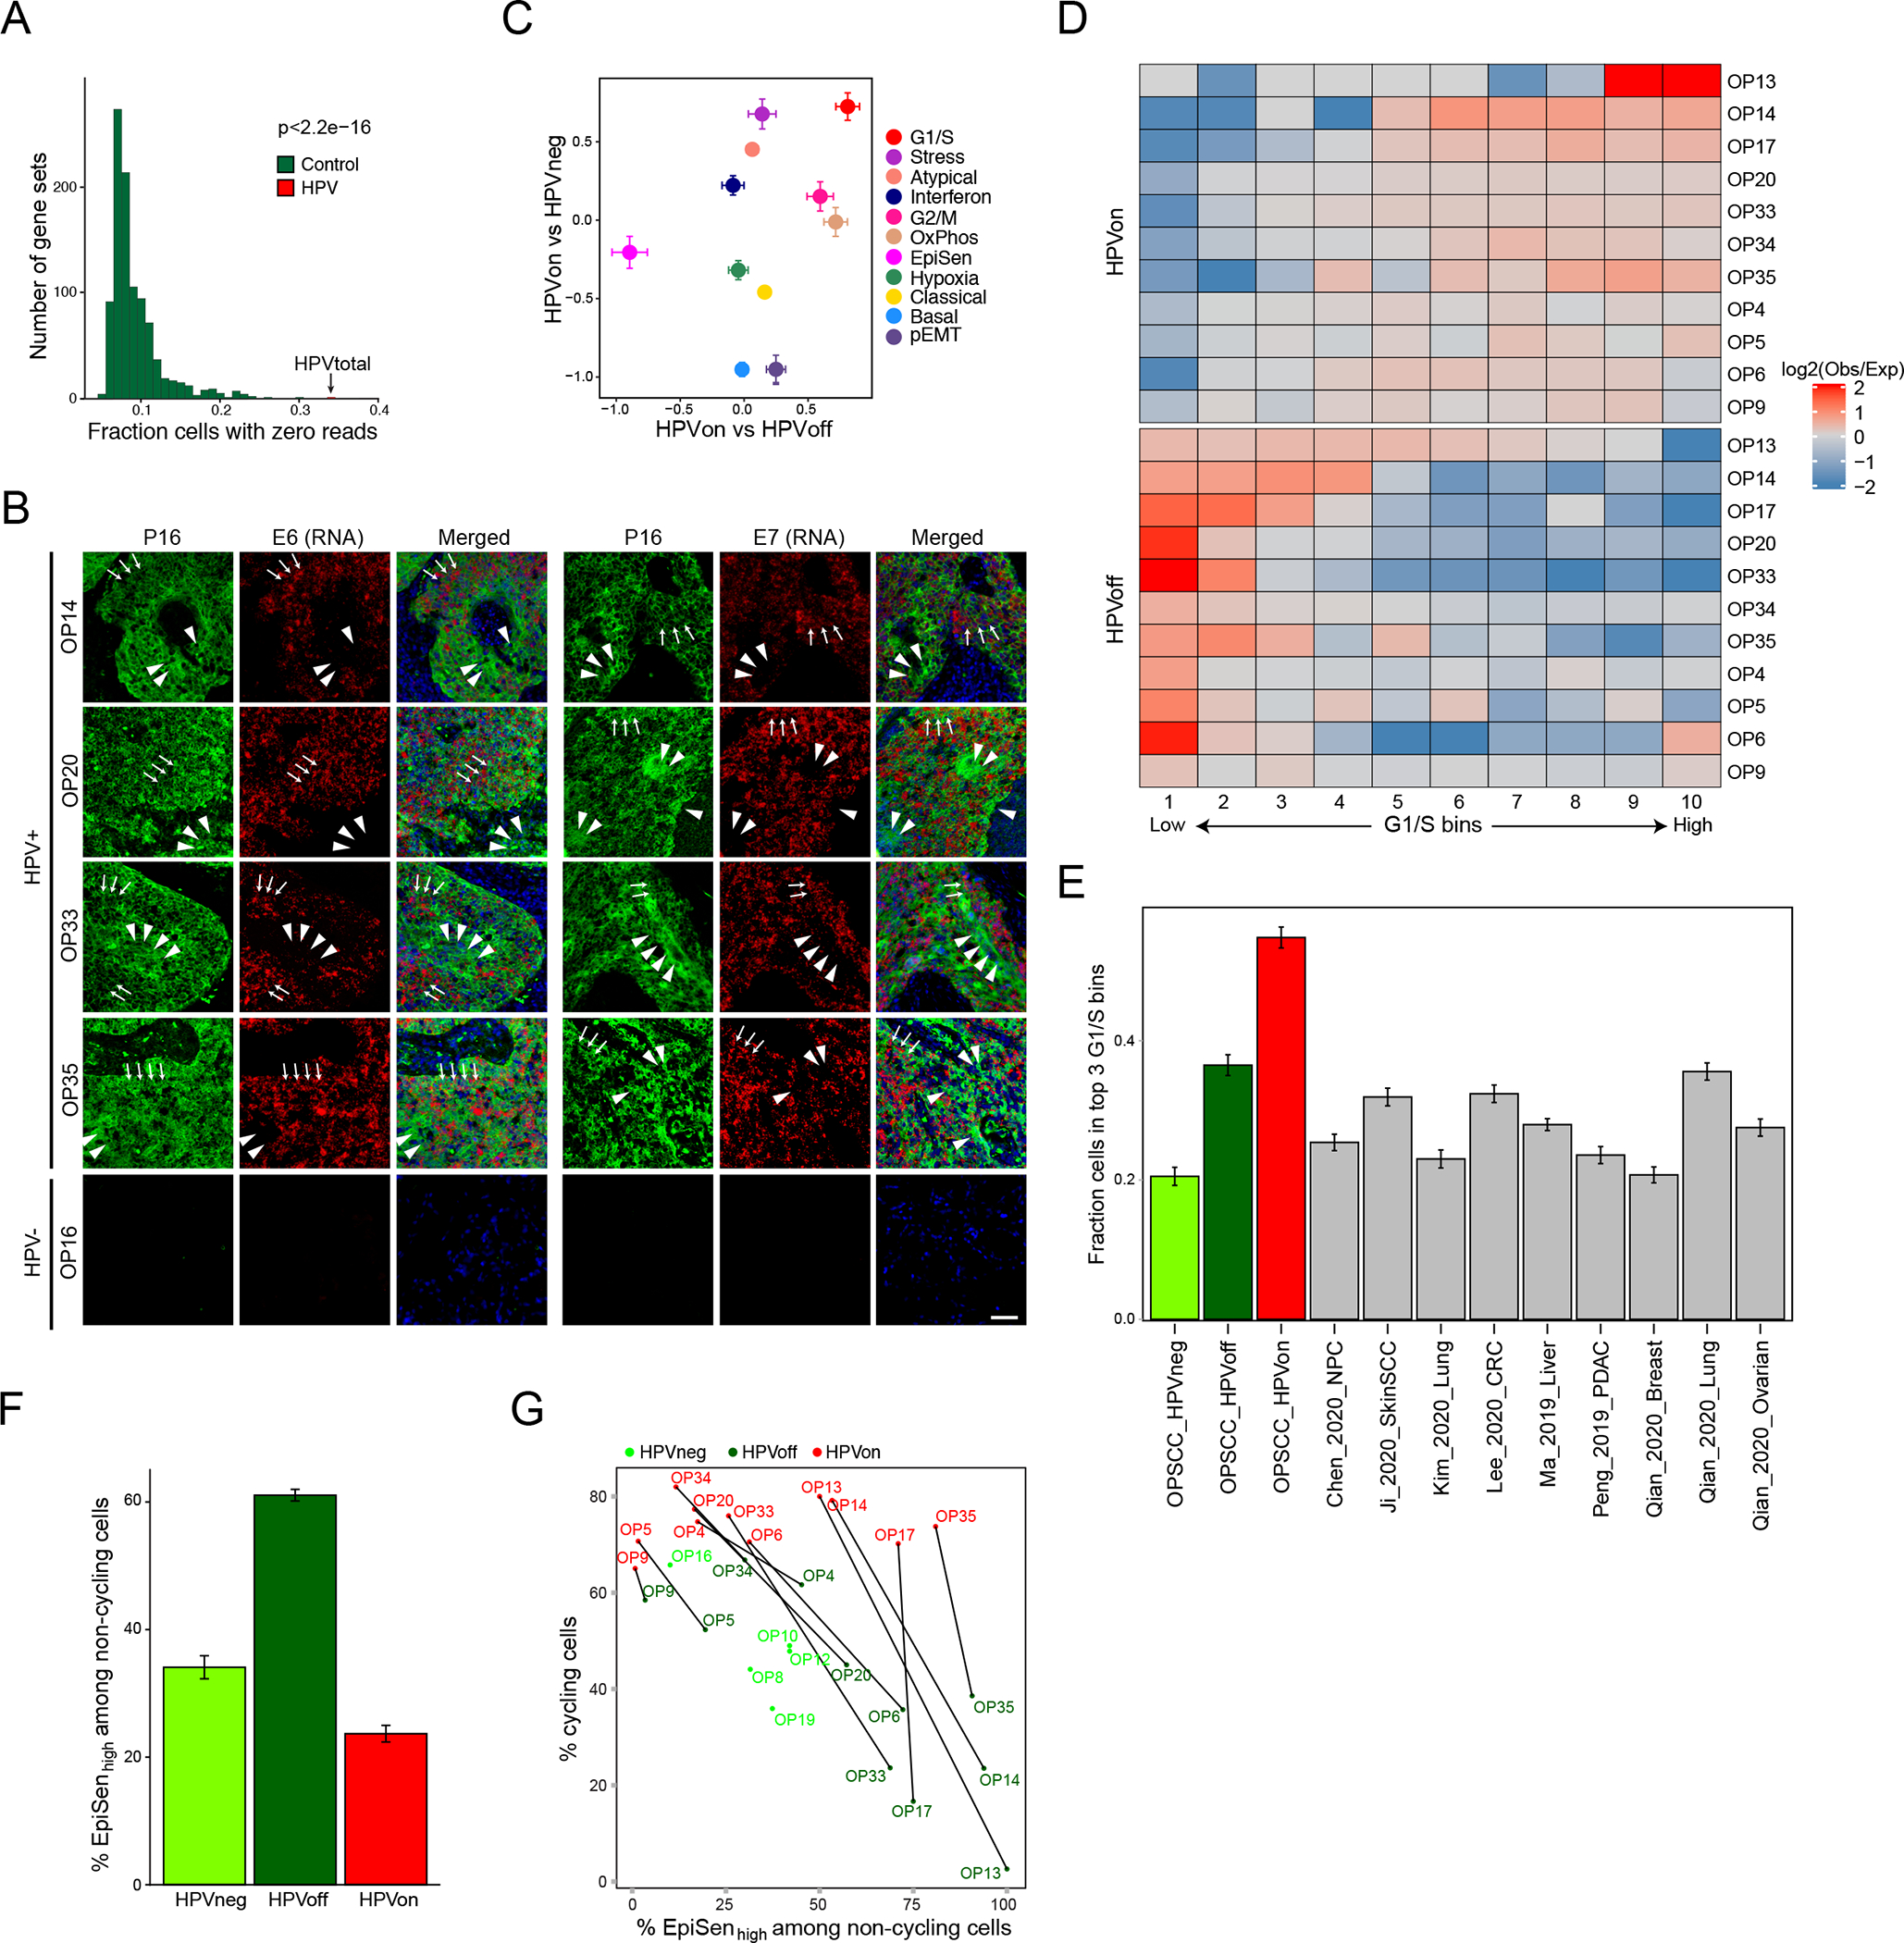
Figure 4. HPVoff cells and their association with cell cycle and senescence.

(A) Fraction of cells with zero reads for 1000 control gene-sets and for the set of five detected HPV genes (E1, E2, E5, E6 and E7). Each control gene-set includes one non-HPV gene as the matched control for each of the five HPV genes. Control genes were randomly sampled among the 100 genes closest to the respective HPV gene, based on average expression across all cancer cells from HPV-positive patients (p<2.2e-16, z-test). (B) RNA ISH (RNAScope) of representative HPV-positive (OP14, OP20, OP33, and OP35) and HPV-negative (OP16) tumors for viral E6 (left) and E7 (right) RNA (red) with immunofluorescence co-staining for regions of tumor as marked by p16 protein (green) and nuclei by DAPI (blue). HPV-positive tumors display regions of p16 positivity with absence of E6 and E7 RNA signal, consistent with an HPVoff state (arrowheads), while other regions have p16 along with E6 and E7 expression (HPVon; arrows). HPV-negative tumors do not have signal for p16 protein or E6 or E7 RNA. Scale bar = 1000 μm. (C) Scatter plot of differences in program expression between cells from different HPV classes. The X-axis shows mean difference, for all genes in each metaprogram, between HPVon and HPVoff cells within the same patient (n=11 patients). The Y-axis shows mean difference between HPVon cells, averaged across all HPV-positive patients (n=11), and HPVneg cells, averaged across HPV-negative patients (n=5). Error bars represent the standard error of the mean for each geneset. (D) Log2-ratio of observed to expected number of cells in each bin of G1/S scores ranked from low (left) to high (right), for each HPV-positive tumor (rows). Top and bottom rows correspond to the HPVon and HPVoff cells, respectively. I Mean fraction of malignant cells with high G1/S expression, as defined by the top 3 bins of G1/S scores, in each HPV class from this work and in multiple external datasets (n=9). Error bars show standard error of the mean fraction from 100 repetitions with sampling of 1000 cells per dataset. (F) Mean proportions of EpiSen-high noncycling cells across HPV subsets in n=5 (HPVneg) and n=11 (HPVon, HPVoff) patients. The top 20% of all malignant cells by average expression of the EpiSen program genes were defined as EpiSen-high. The y-axis shows, per subset, the mean proportion of EpiSen-high noncycling cells among all noncycling cells. Error bars represent standard error after resampling 100 times, each time sampling 200 cells per patient and subset. (G) Proportions of cycling cells and EpiSen-high noncycling cells for each patient and HPV subset.
