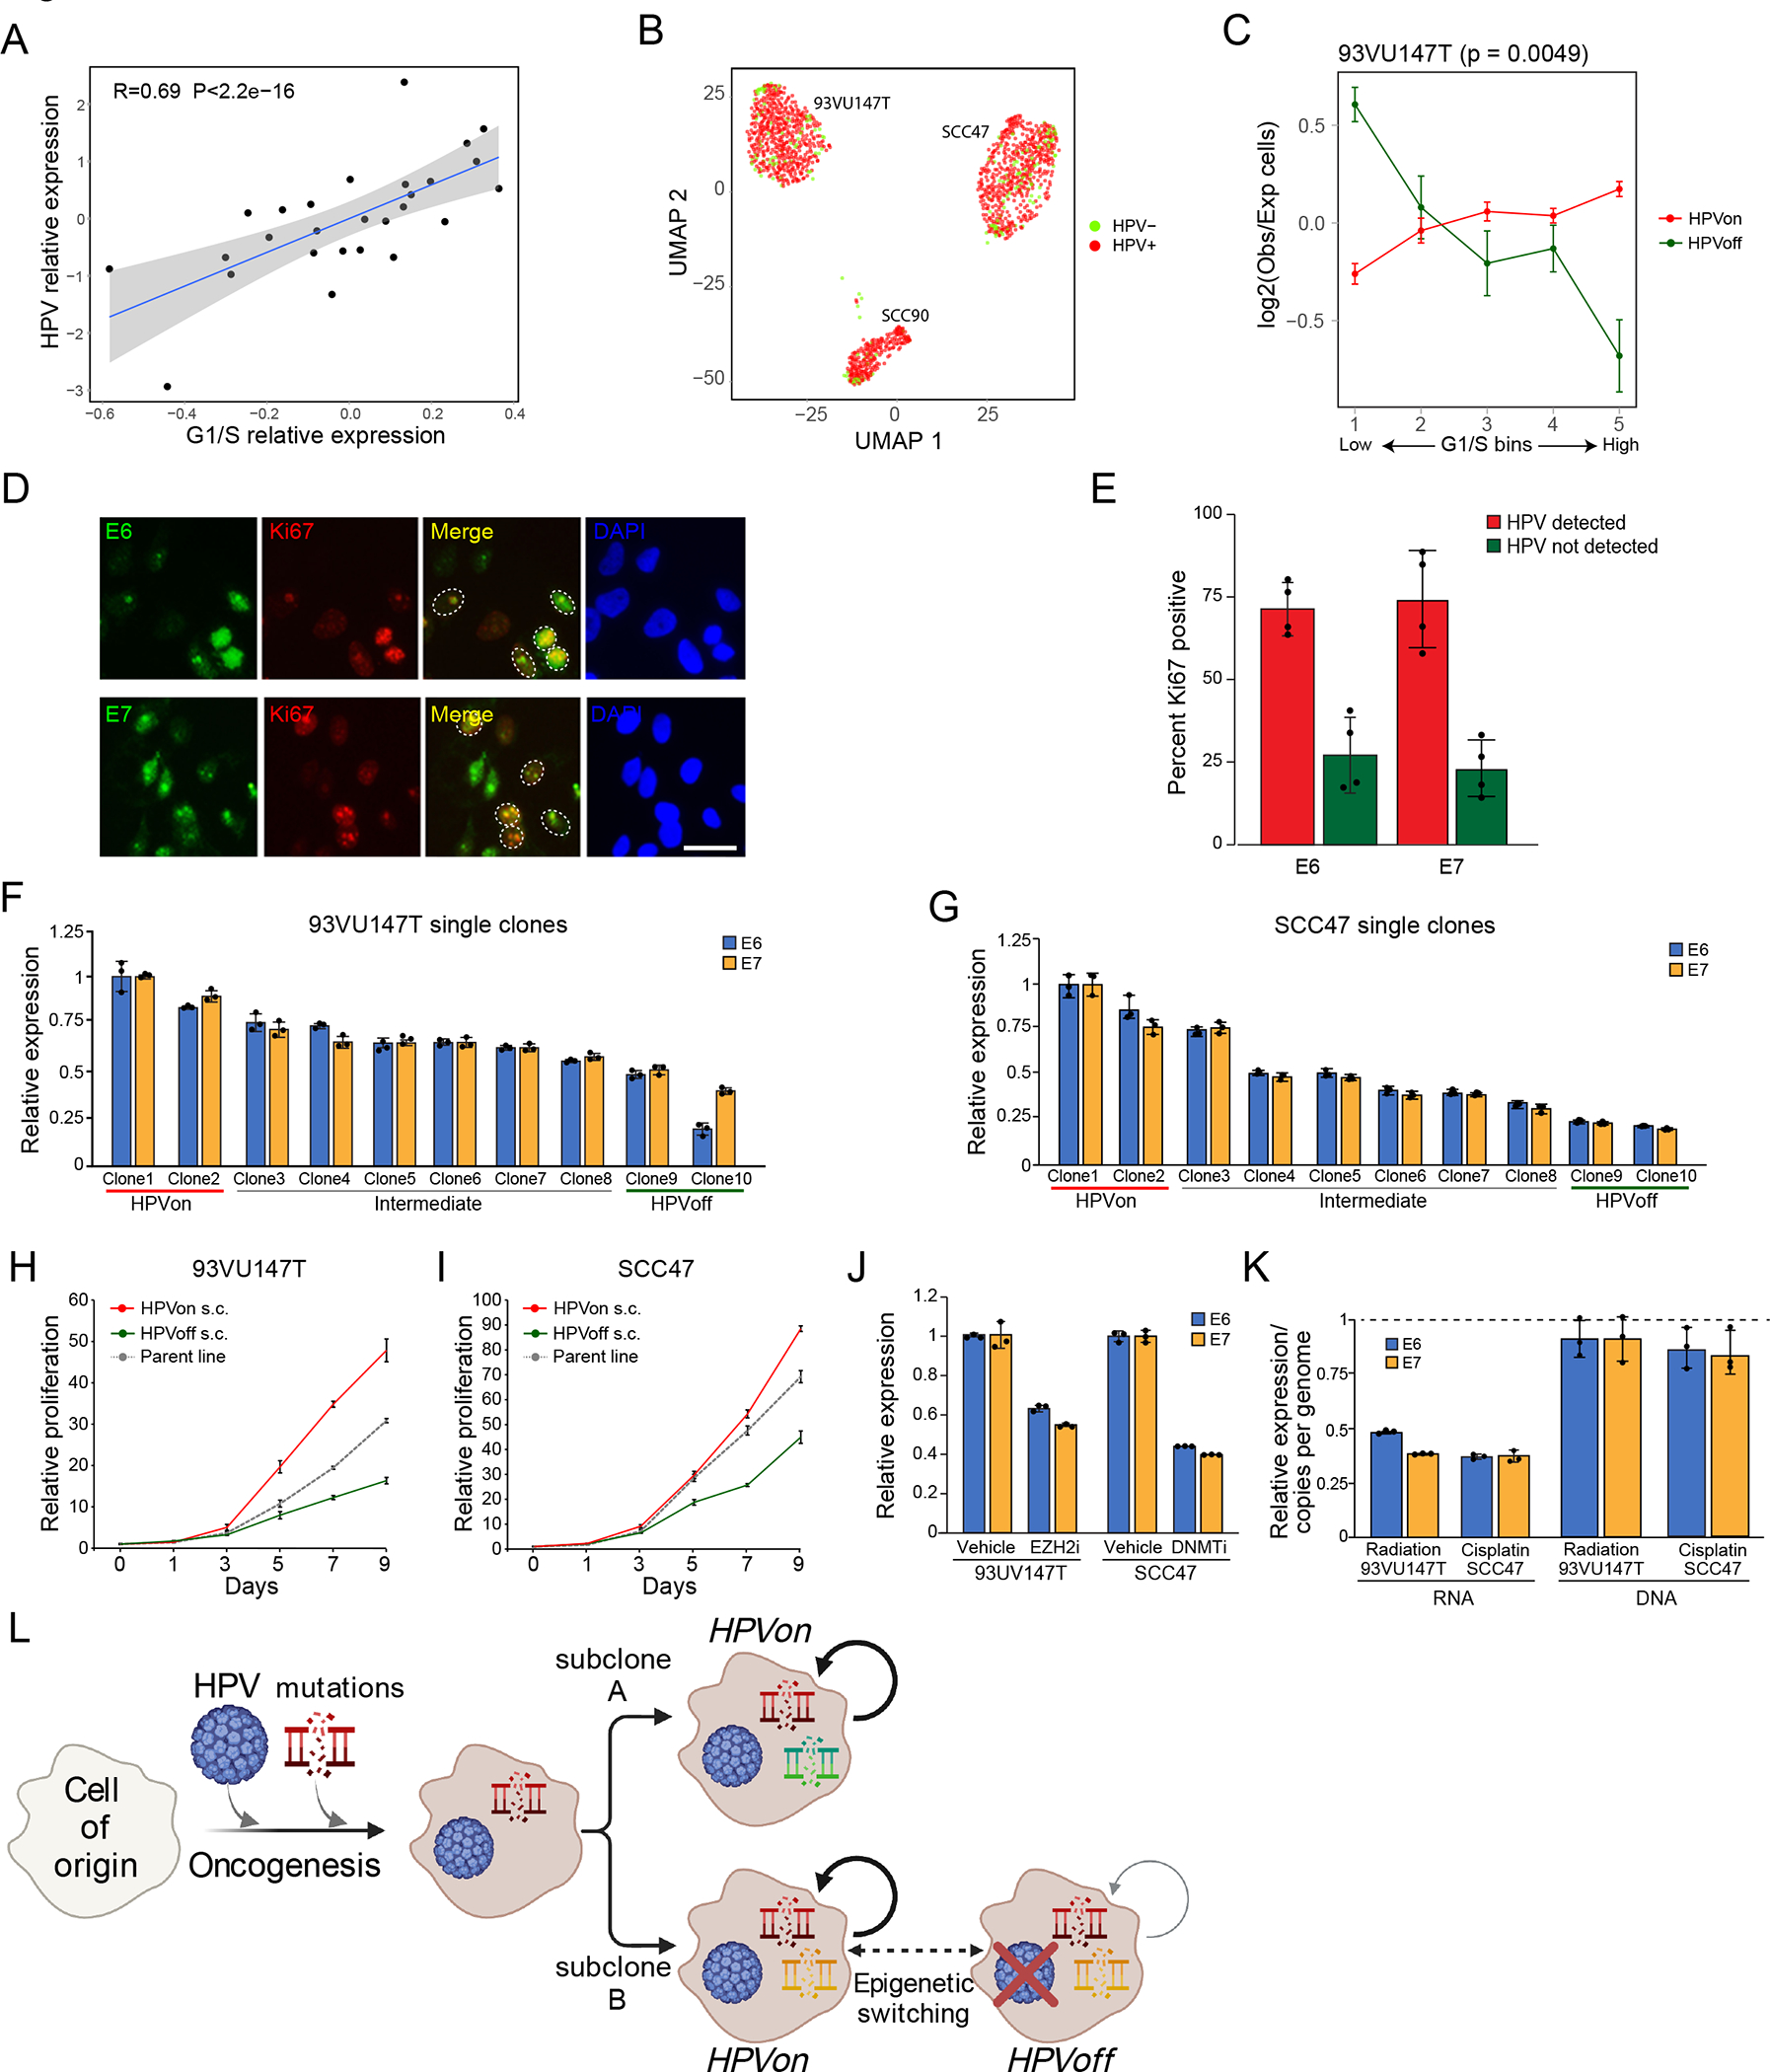
Figure 5. Regulation and function of HPVoff cells.

(A) Scatter plot of all HPV-positive OPSCC samples in the TCGA cohort, showing correlation (two-sided Pearson correlation test) between the relative expression of HPV and of the genes in the G1/S program. Relative expression values reflect residuals, after normalizing each sample for malignant cell content (using the epithelial signature from Supplementary Table 3). (B) UMAP of 1,422 cells from three HPV-positive cell lines colored by HPV expression. Cells with at least one read from an HPV16 gene were considered HPV+. (C) Differences in expression of the G1/S genes between HPV subsets in the HPV-positive cell line 93VU147T. Cells were divided into 5 bins of equal size, ranked by average expression. The Y-axis shows mean ratio of cells belonging to an HPV subset in a bin versus the expected number of cells, assuming random distribution across bins. Error bars are standard error after 100 resampling runs, where 100 cells per subset were randomly selected. P-value based on chi-square test, comparing the distribution of cells per bin between the groups. (D) Immunocytochemistry images of 93VU147T cells probed with Ki67 (red) and E6 (green, top) or E7 (green, bottom). Nuclei were stained and visualized with DAPI (blue). Scale bar = 100 μm. (E) Bar plot (mean +/− SEM) shows percentage of Ki67 positive cells among E6 and E7 positive cells (HPV detected; red) and E6 and E7 negative cells (HPV not detected; green). 50 cells were counted across four fields (p<0.00001, chi-square). (F and G) Bar plot (mean +/− SEM) shows relative expression of E6 and E7 among single clones (n=10) derived from 93VU147T (F) and SCC47 (G) revealing diversity in HPV expression (p<0.00001, ANOVA).(H and I) Line graph (mean +/− SEM) shows relative proliferation of HPVon and HPVoff single clones derived from 93VU147T (H) and SCC47 (I) compared to parent line. HPVon single clones displayed substantially more relative proliferation than HPVoff single clones (n=3; p<0.00001, two-sided t-test). (J) Left: Bar plot (mean +/− SEM) shows relative expression of E6 and E7 in 93VU147T cells treated with vehicle or tazemetostat (EZH2 inhibitor) (left). Right: Bar plot (mean +/− SEM) shows relative expression of E6 and E7 in SCC47 cells treated with vehicle or decitabine (DNMT inhibitor). Tazemetostat and decitabine significantly reduced relative E6 and E7 expression compared to vehicle in 93VU147T cells and SCC47 cells, respectively (n=3; p<0.001 and p<0.00001, ANOVA). (K) Left: Bar plot (mean +/− SEM) shows relative expression of E6 and E7 in 93VU147T and SCC47 cells treated with radiation or cisplatin, respectively, normalized to control cells (dashed line) (n=3; p<0.00005, two-sided t-test). Right: Bar plot (mean +/− SEM) depicts HPV copies per genome of E6 and E7 (normalized to albumin) for 93VU147T and SCC47 cells treated with radiation or cisplatin, respectively, normalized to control cells (dashed line). There were no significant differences in HPV copies in genomic DNA in radiation or cisplatin treated cells compared to control (n=3). (L) Model of genomic and viral heterogeneity in HPV-related OPSCC. A combination of HPV infection and associated genetic mutations trigger oncogenesis. Some genetic subclones continue to express HPV (HPVon), while others may undergo epigenetic switching with repression of HPV expression (HPVoff) and an associated decrease in cell cycle (circled arrows).
