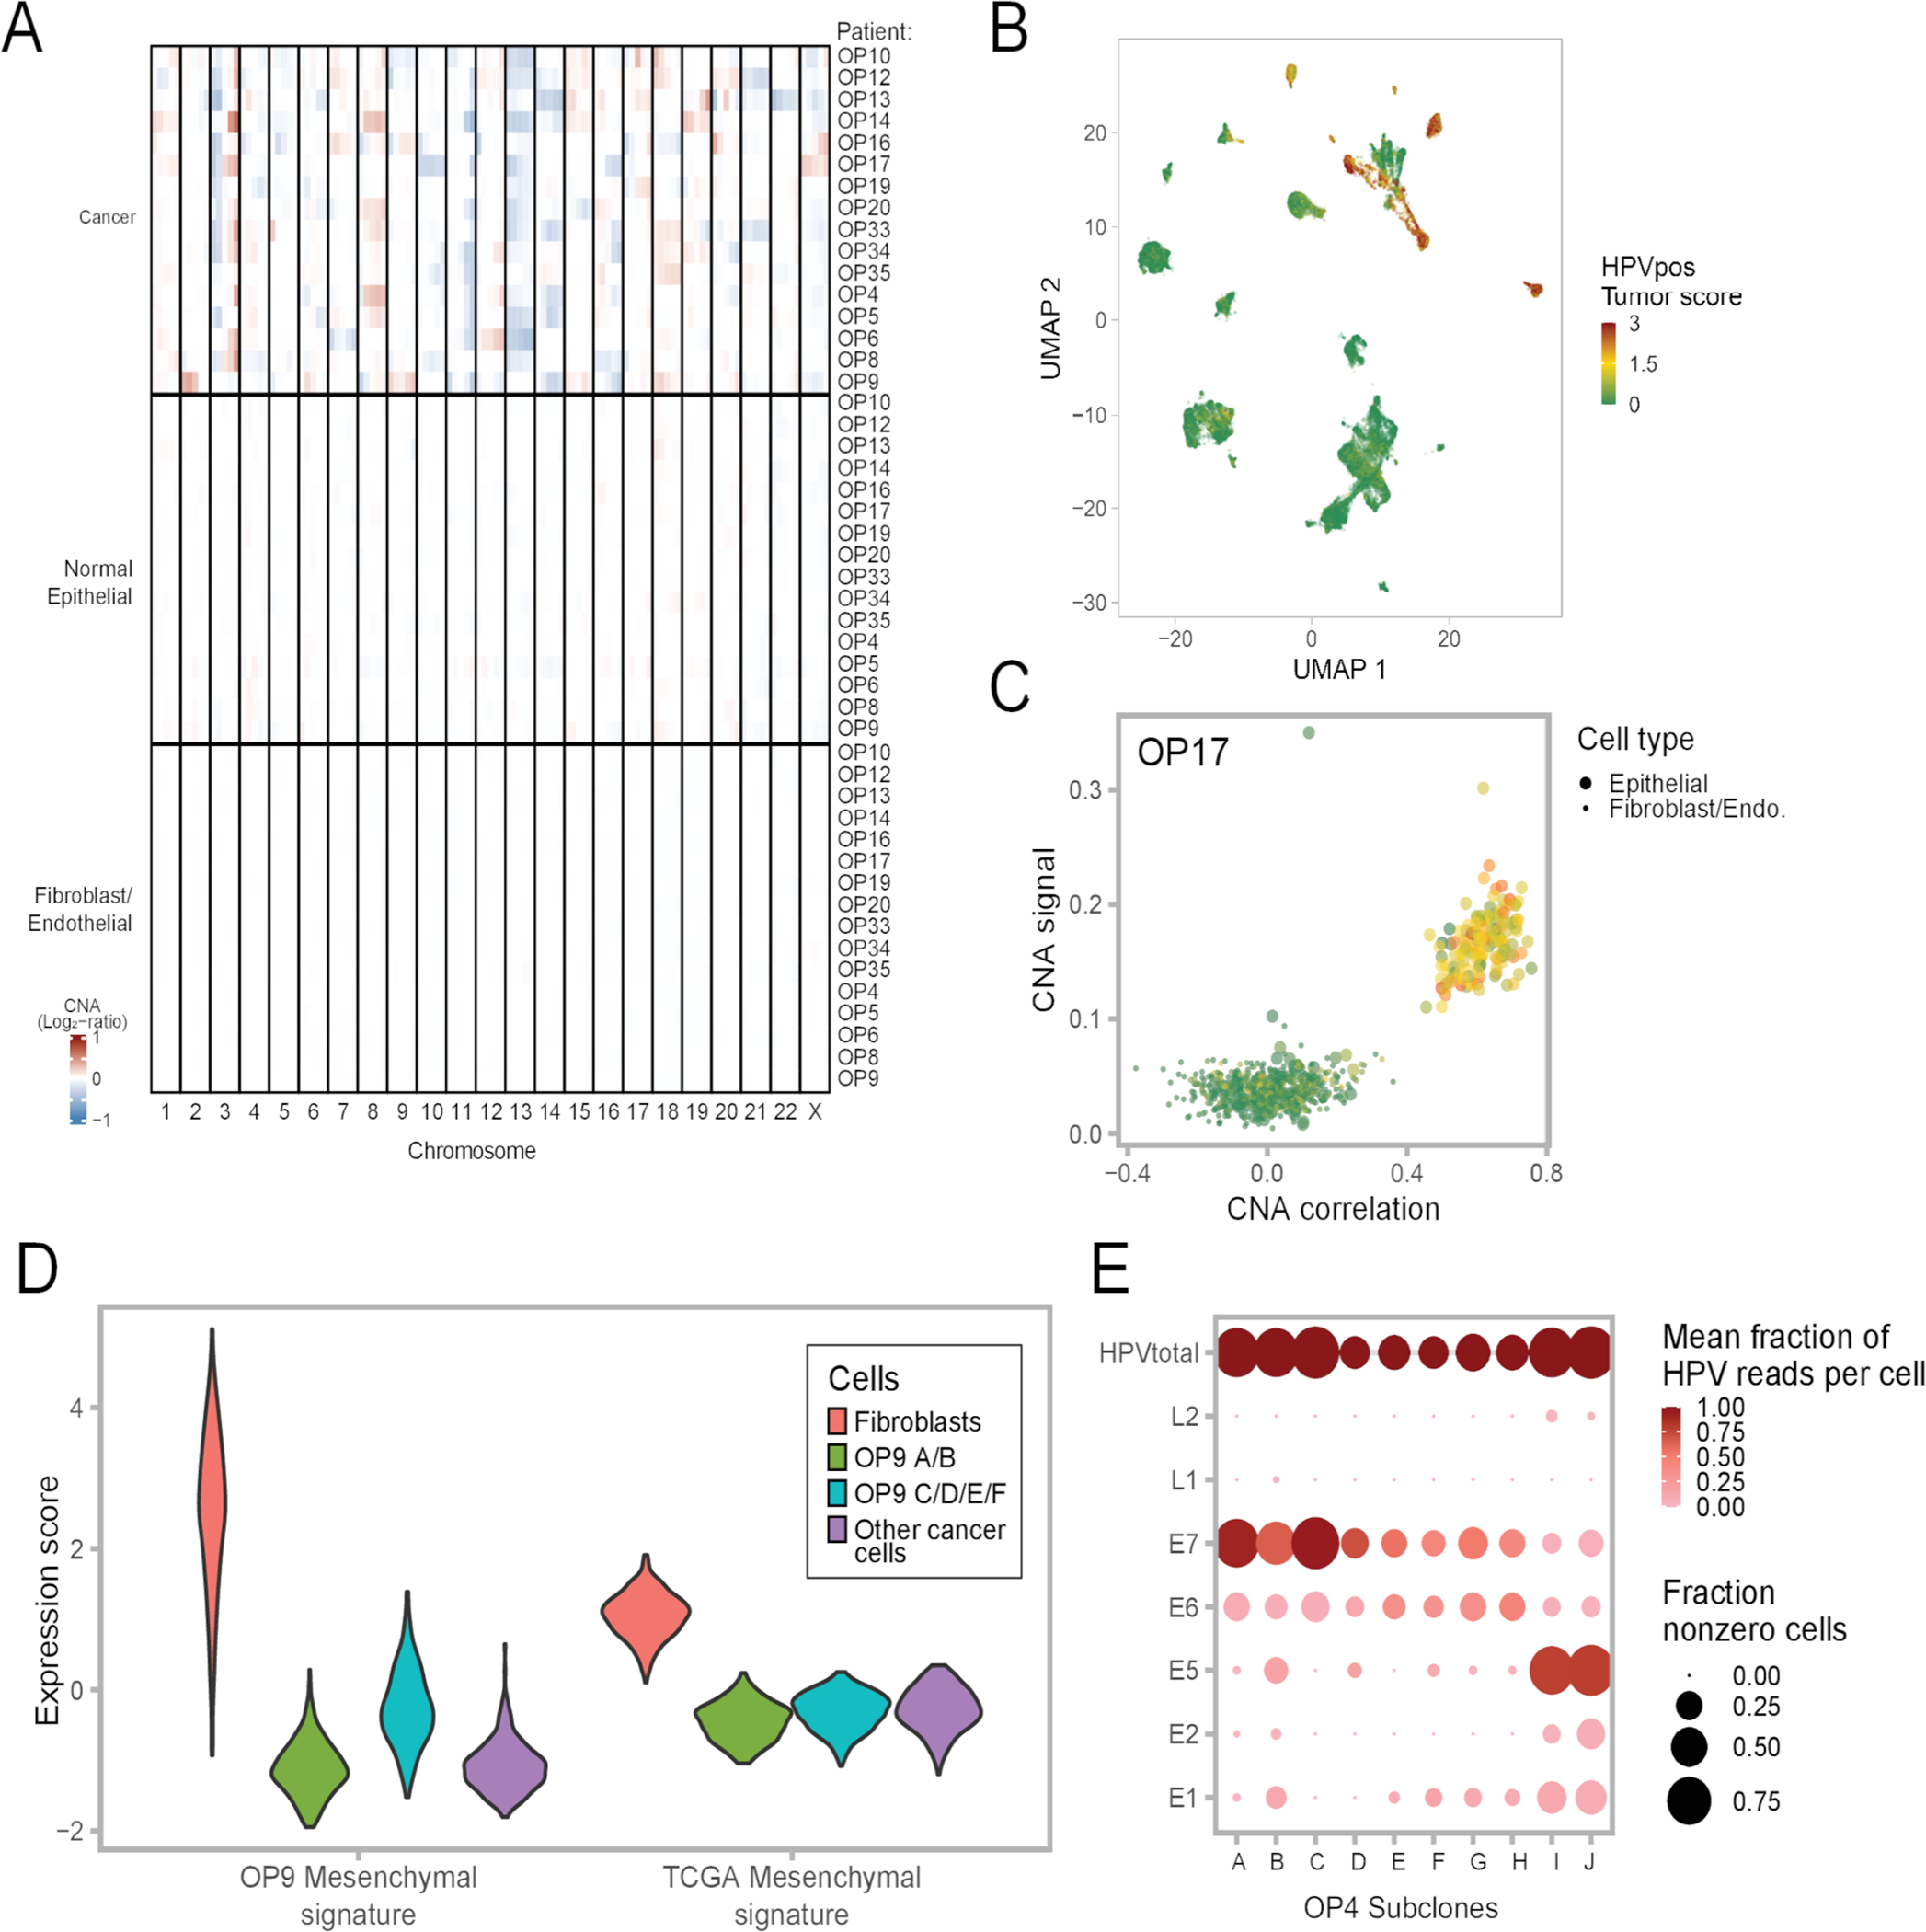
Extended Data Fig. 2. CNA patterns and controls, related to Figure 2.

(A) Average CNA profiles of malignant cells, normal epithelial cells and fibroblasts/endothelial cells used as reference for each patient. Each row is a cell subset within a patient. Rows are ordered by cell subset and patient ID. Columns are chromosomal positions. For each row and chromosome, the chromosome was split into five bins.
(B) UMAP of all cells colored by HPV-positive tumor score.
(C) CNA signal and correlation scatter plot of OP17. Cells are colored by their expression of the HPV-positive tumor score.
(D) Violin plots showing expression of the OP9 mesenchymal signature (left panel) and the TCGA HNSCC mesenchymal signature (right panel) in four subsets of cells; 300 cells were randomly sampled from each subset to ensure equal-sized groups.
(E) Dot plot showing variability in HPV gene expression between subclones in one patient, OP4. The size of each dot represents the fraction of cells with at least one read for that gene in each subclone, while the color represents the fraction of HPV reads in one subclone that reflect the corresponding gene. For the latter metric, HPVtotal is set to 1.
