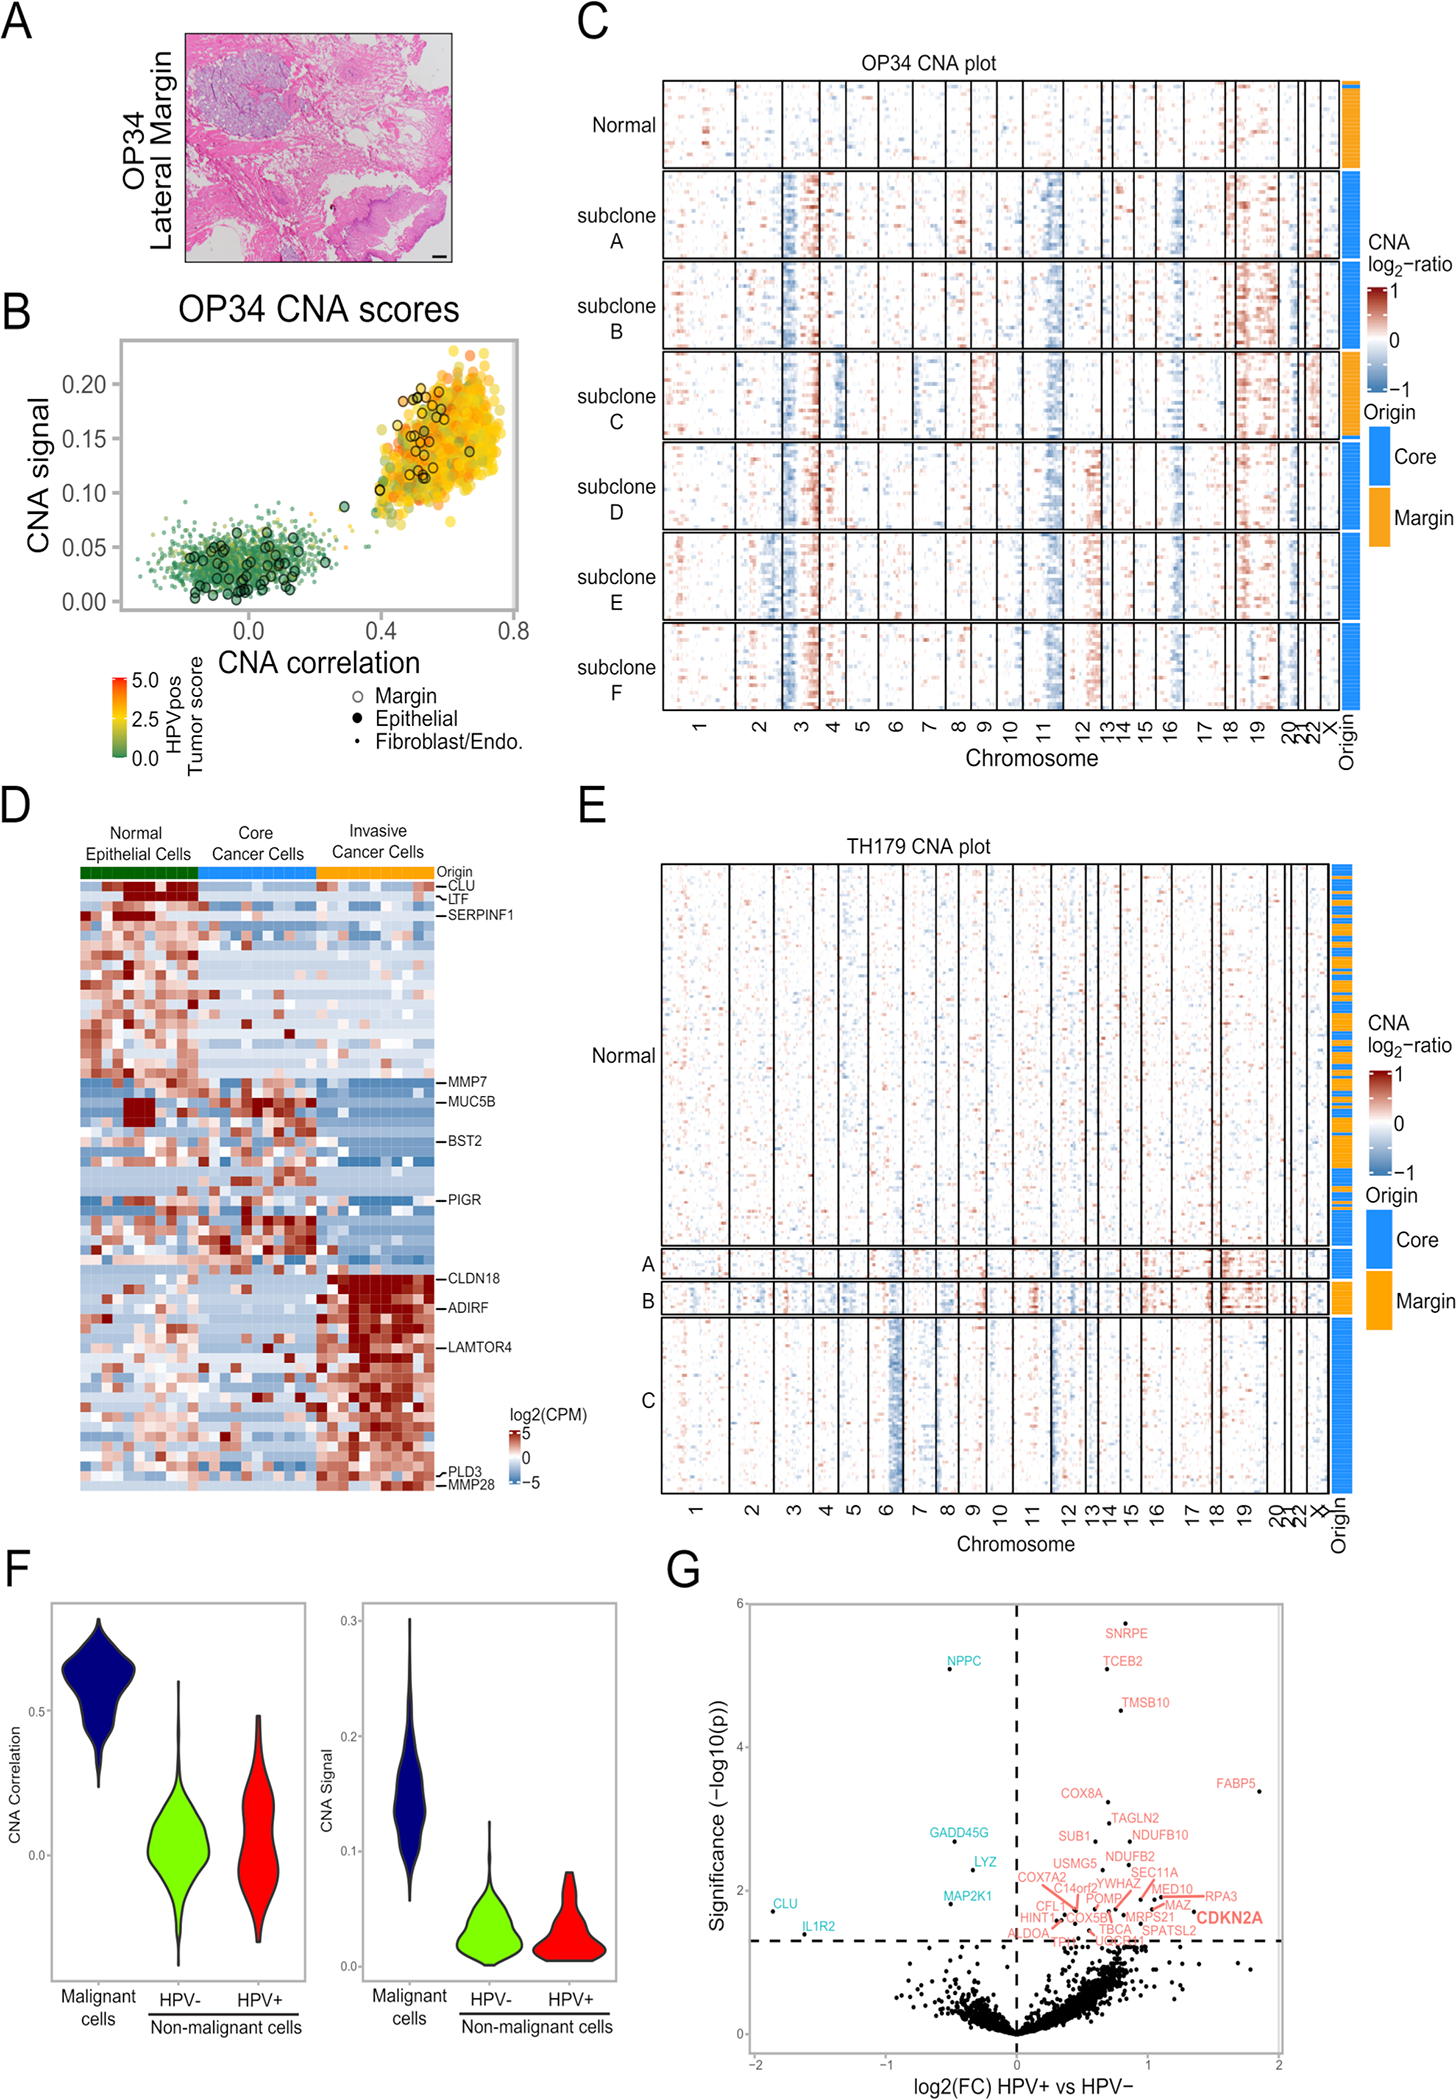
Extended Data Fig. 3. CNA-based detection of invasive malignant cells, related to Figure 2.

(A) Histologic section of the lateral margin from OP34, stained by H&E. A piece of mucosa was taken beyond this histologically clear (pathologically negative) margin for scRNA-seq (labeled ‘margin’). Staining was repeated three independent times with similar results. Scale bar = 1000 μm.
(B) CNA signal and correlation scatter plot of OP34. Cells are colored by their expression of the HPV-positive tumor score. Epithelial cells from the margin sample are circled.
(C) CNA plot of OP34. Cells were randomly sampled from all subclones in equal numbers to ensure equal-sized groups. Column at the right shows the origin of cells from the tumor core and margin samples.
(D) Heatmap of differentially expressed genes in the three epithelial cell subsets of lung adenocarcinoma sample TH179 – normal epithelial cells, invasive malignant cells and malignant cells from the tumor core. Rows are genes, columns are cells. Cells were randomly sampled from the normal and core subsets to ensure equal-sized groups.
(E) CNA plot of lung adenocarcinoma sample TH179. Column at the right shows the origin of cells from the tumor core and margin samples.
(F) HPV expression in normal epithelial cells. Violin plots showing values for CNA signal and CNA correlation for the 51 HPV-positive and 779 HPV-negative negative nonmalignant epithelial cells from HPV-positive patients, as well as for 830 randomly sampled cancer cells from the same patients, one cancer cell per patient sampled per nonmalignant epithelial cell.
(G) Volcano plot of differentially expressed genes between nonmalignant epithelial cells (defined by lack of CNAs) with or without HPV expression. P-value derived from two-sided t-test adjusted for multiple comparisons.
