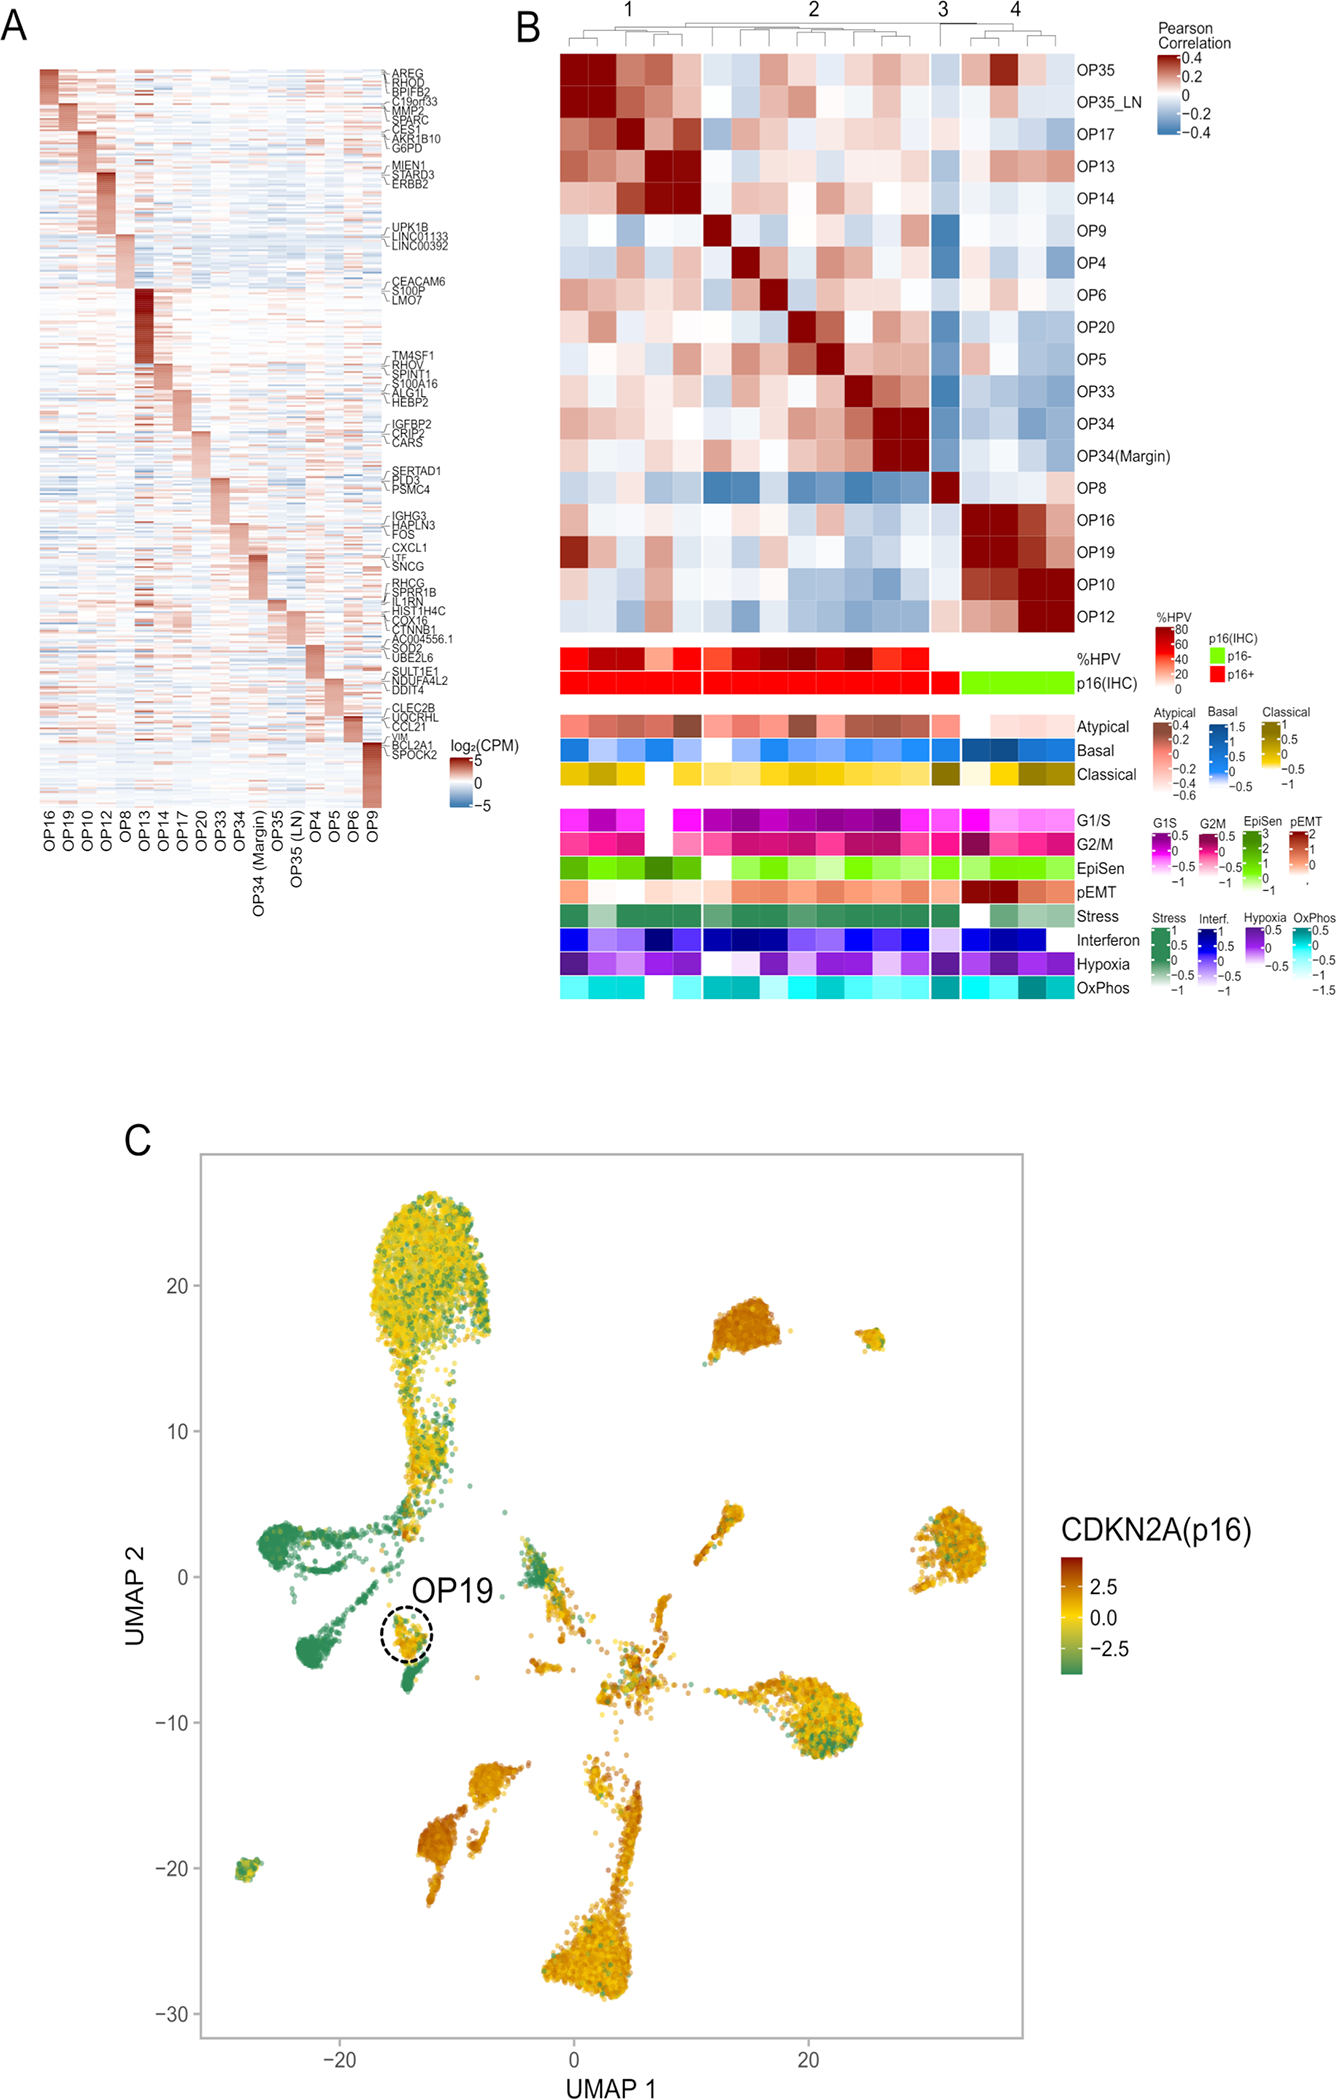
Extended Data Fig. 4. Diversity of malignant cells across tumors, related to Figure 3.

(A) Heatmap showing relative expression of differentially expressed genes (rows) across all tumor samples (columns). Selected genes include the top 50 preferentially expressed genes from each tumor.
(B) Hierarchical clustering of “pseudobulk” tumor profiles (defined by averaging all malignant cells per sample). Shown are Pearson correlations, ordered by the clustering of samples. Bottom panels show additional tumor characteristics with the same tumor ordering as in the heatmap, including (from top to bottom): the percentage of cells with detected HPV reads, the clinical HPV status (defined by p16 staining), three TCGA subtype scores, and scores for all meta-programs defined in Fig. 3c–d.
(C) UMAP of all malignant cells, colored by mRNA expression of CDKN2A (encoding for p16). OP19 is circled.
