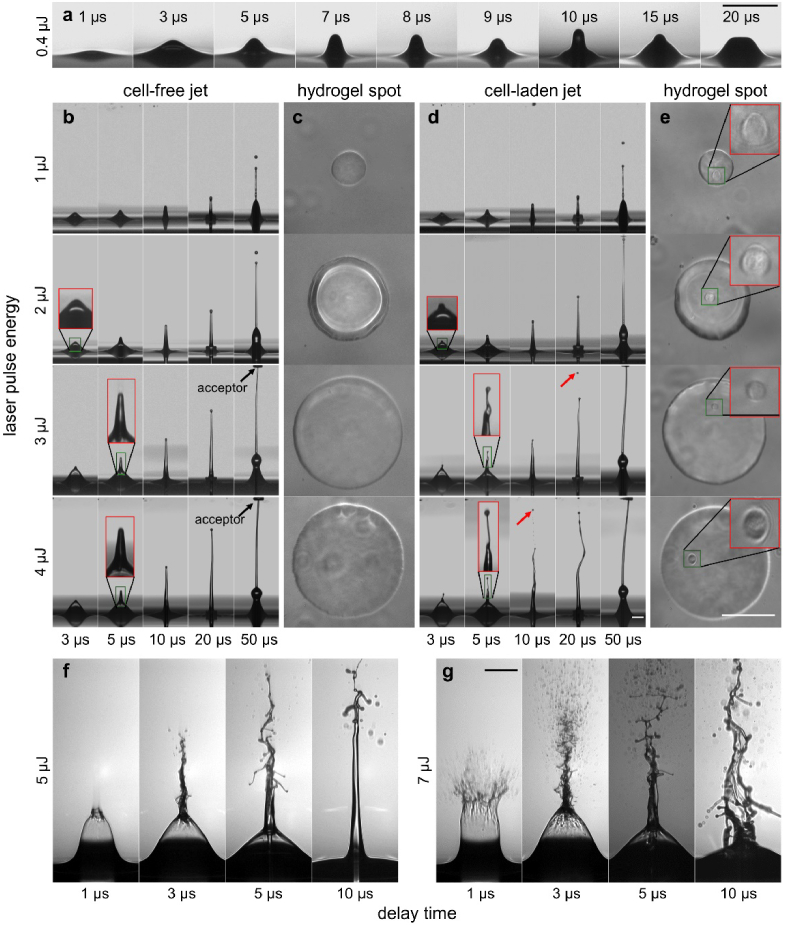
Fig. 3.
Time-resolved images of the laser-induced jet dynamics in variation of laser pulse energy from 0.4 to 7 µJ, while the focus depth was fixed at 52 µm. (a) The laser pulse energy is too low to transfer the hydrogel. (b) Cell-free and (d) cell-laden jets (single B16F1 cells) and (c and e) the corresponding transferred hydrogel spots on the acceptor slide. The lower part of the time series images shows an angled view onto the reservoir’s hydrogel surface. The upper margin of the images gives an angled view onto the acceptor slide (indicated with black arrows). The red rectangles display a 3-fold magnification of the green rectangles in the respective columns. Red arrows indicate the single cells separated from the jet. (f and g) At 5 and 7 µJ jets tend to develop in an unstable turbulent and splashing form. All scale bars are 100 µm.

