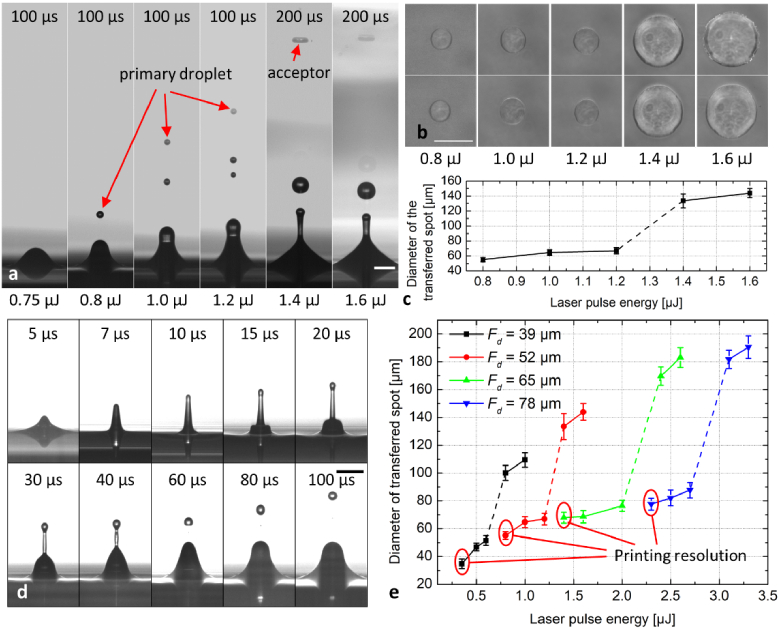
Fig. 7.
(a) Jet form by carefully increasing laser pulse energies at a fixed focus depth of 52 µm and delay times of 100 µs or 200 µs slightly below and above the single jet threshold of 0.8 µJ. (b) Microscope image of the corresponding transferred hydrogel spots on the acceptor slide and (c) their diameters versus laser pulse energy. (d) Time-resolved image of the breakup process from the first jet by using the threshold energy at 0.8 µJ. (e) Plot of the transferred spot diameter by increasing the laser pulse energy and focus depth. All scale bars are 100 µm.

