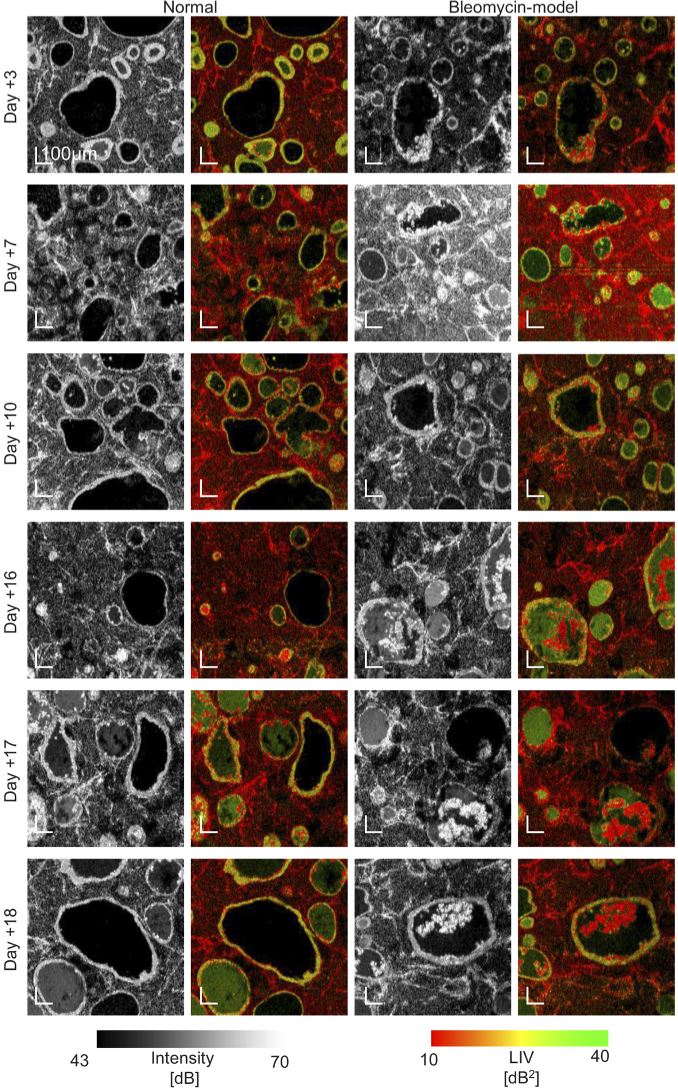
Fig. 5.
The en face OCT-intensity and LIV images at all time points. The samples are the same with Fig. 4 but measured with a smaller FOV of . Due to the smaller pixel separation (i.e. higher pixel density) than that of Fig. 4, finer structures are visible. The images were extracted approximately below the sample surface. The normal model at Day +3 is the same image with Fig. 2.

