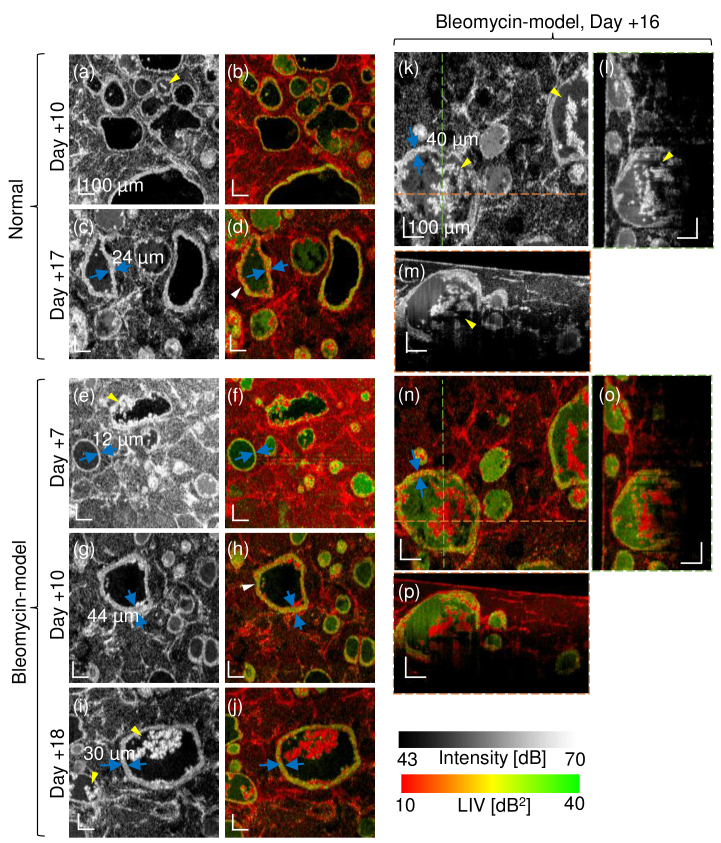
Fig. 7.
Selected OCT-intensity and LIV images showing several types of alveoli. The samples are the Days +10 and +17 normal model and the Days +7, +10, +16 and +18 bleomycin model. The FOV of the en face image is . (l), (m), (o) and (p) are the cross-sections at the green and orange lines in the corresponding en face image (k) and (n). The tessellated dynamic appearance of the alveolar epithelium is denoted by the white arrows, and the ragged alveoli that encapsulate the hyper-scattering mass are indicated by yellow arrows. The en face images are a subset of Fig. 5.

