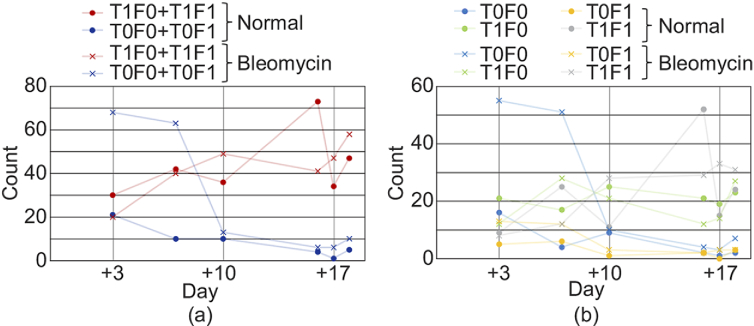
Fig. 8.
(a) Counts of the tessellated and non-tessellated alveoli. Here the counts are the summations of filled and non-filled alveoli. (b) Count of all four types of alveoli. The counts in the normal and bleomycin models are plotted with dots and cross marks, respectively. The counts were obtained using en face images with a FOV of as described in Section 2.5. As shown in (a), the tessellated alveoli (red) show an increasing trend over time for the both normal and bleomycin-model organoids. In contrast, the non-tessellated alveoli (blue) show a decreasing trend over time for both models.

