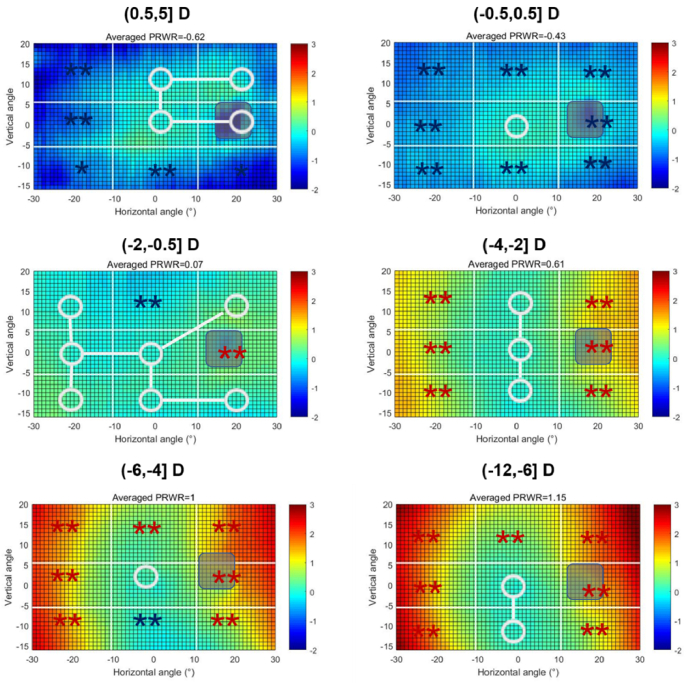
Fig. 2.
Averaged two-dimensional (2D) maps of the relative peripheral refraction (RPR) in the six refractive groups. The positive and negative values on the x-axis indicate the nasal-retinal and temporal-retinal and for the y-axis, the positive and negative values represent the superior and inferior retinas, respectively. The color code is in diopters. The white circle represents no statistical difference between the zone and the center zone MZ2, and the blue star (*) or red star (*) presents a statistically myopic or hyperopic difference, respectively. The color code for each map was uniformly set, ranging from −2D to 3D.

