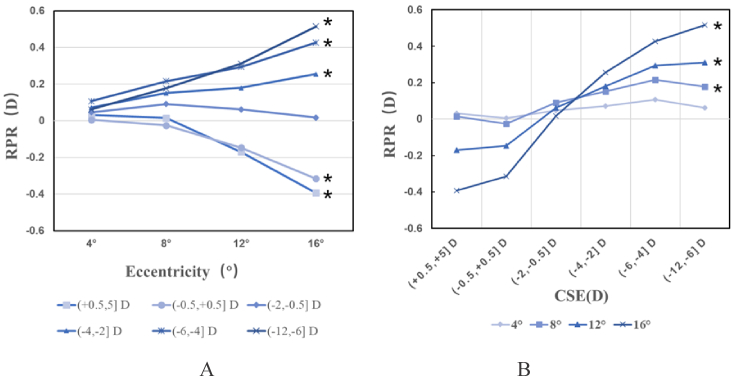
Fig. 4.
Average relative peripheral refraction (RPR) in six groups of the four annular regions. In picture A, the x-axis shows rings with different eccentricity, and the y-axis in diopters shows the averaged refraction of the annular areas. In picture B, the x-axis shows the six groups, and the y-axis in diopters shows the averaged refraction of annular areas. The asterisks* represent statistical differences in linear test results in both Figs. (A) and (B).

