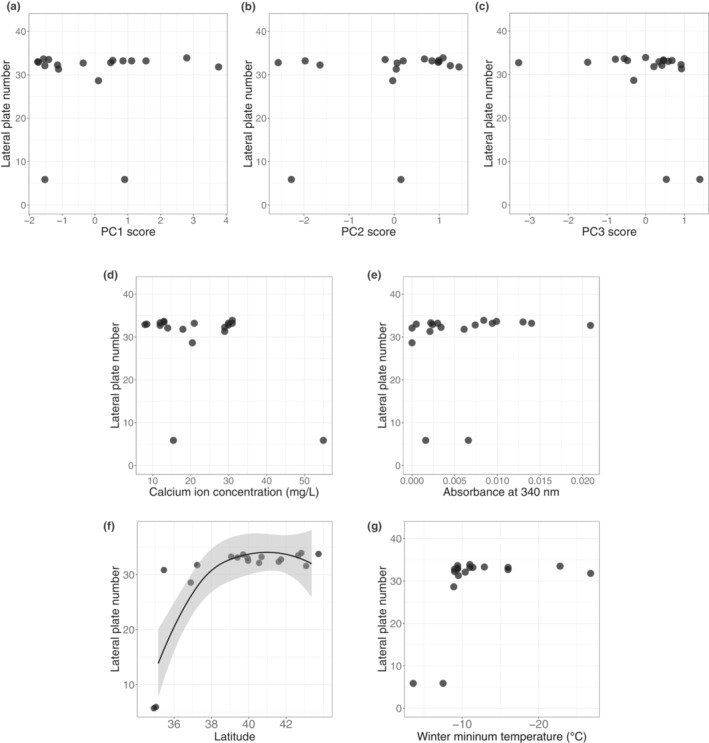
FIGURE 3.

Scatterplots between lateral plate number and several environmental factors. The Y‐axis indicates the mean plate number in each freshwater habitat. The X‐axis indicates (a) Principal component (PC)1 score, (b) PC2 score, (c) PC3 score, (d) free calcium ion concentration, (e) habitat water absorbance at 340 nm, (f) latitude, and (g) minimum temperature. For visualization, data are fitted with LOESS regression in (f).
