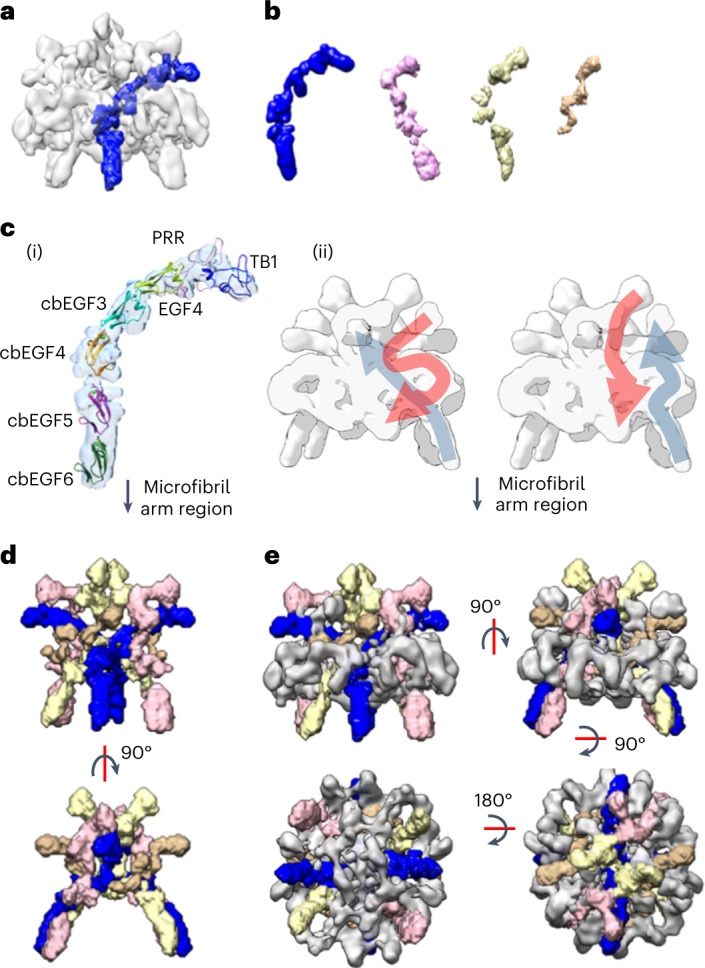
Fig. 2. Modeling of the fibrillin N-terminal region into the fibrillin bead region.

a, Cryo-EM structure of the fibrillin bead region with a feature (in the centre of the bead map) that remained connected at high threshold levels segmented and highlighted in blue. b, The four unique (not symmetry-related) copies of this region are segmented from the bead map. The feature shown in a is colored blue. As twofold symmetry has been applied to the reconstruction, there are also symmetric pairs of each of these features to give eight in total in the bead core. c, (i) A SAXS-derived model of the region encompassing TB1, the PRR, EGF4 and cbEGF3–6 (ref. 45) is docked into the region from the core of the bead segmented in a (shown as pale blue density). (ii) A cross-section through the bead density is shown with schematic representation of the N-terminal region (blue) running through the core of the bead (as modeled in c (i)) and C-terminal region (red) in the outer density. On the right, an alternative representation is presented where the C-terminal region could be in the inner core of the bead with the N-terminal region around the outside. In both, the cbEGF5 and cbEGF6 domains would be in the same location as their connection to the density in the arm region is contiguous. d, The four central densities shown in b and their symmetric pairs are segmented from the bead structure and colored as in b and are shown without the remaining bead structure. e, As in d, but shown with the remaining bead density colored gray.
