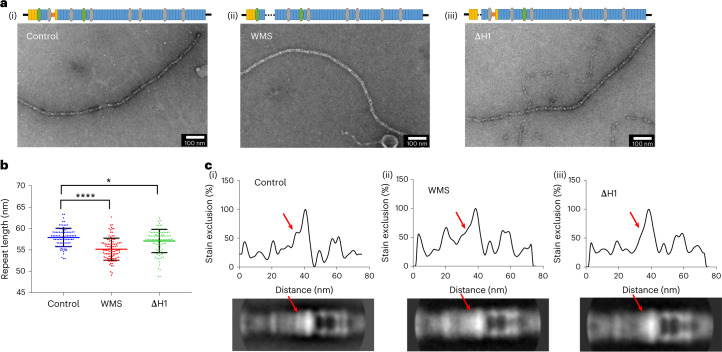
Fig. 3. Mutant fibrillin microfibrils reveal a disrupted shoulder region.
Fibrillin microfibrils extracted from control and homozygous WMS and ∆H1 mouse skin and imaged using negative stain TEM. a, Representative TEM images of (i) control, (ii) WMS and (iii) ∆H1 extracted fibrillin microfibrils. Scale bars, 100 nm. Schematic of the fibrillin domain structure is shown above each image, with the WMS and ΔH1 domain deletions represented as dotted lines. b, Scatter plot showing the periodicities of the control, WMS and ∆H1 extracted fibrillin microfibrils. The data represent means ± s.d. For each dataset, 100 microfibril periods were measured and statistical analysis shows that the mutated microfibrils were significantly different from the control (*P = 0.042; ****P < 0.0001), as determined by one-way analysis of variance with Dunnett’s multiple comparisons test. c, Averaged images were generated from 458 wild-type periods, 472 ∆H1 periods and 476 WMS periods. The top panels show 2D plots of the stain exclusion/intensity profile across the averaged fibrillin microfibril period (bottom panels) for (i) control, (ii) WMS and (iii) ∆H1 microfibrils. The red arrows highlight a region at one side of the bead of the microfibril that is disrupted in the mutated microfibrils.

