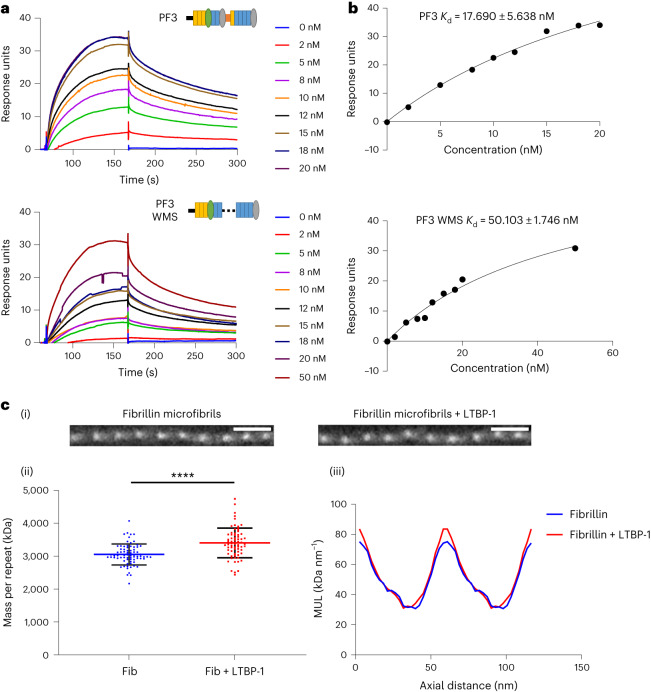
Fig. 4. LTBP-1 binds to the bead region of fibrillin microfibrils and is disrupted by a WMS-causing mutation.
a, SPR analysis of LTBP-1 binding to the N-terminal fragment PF3 of fibrillin with and without the WMS deletion. The LTBP-1 C-terminal region was immobilized to the sensor chip using amine coupling, and concentrations of PF3 (0–20 nM) and PF3 WMS (0–50 nM) were flowed over as analytes. Representative sensorgrams show the binding of PF3 or PF3 WMS to LTBP-1. This experiment was repeated three times. b, Binding kinetics, as determined using equilibrium analysis for the interaction of PF3 or PF3 WMS with LTBP-1. c, A complex of full-length LTBP-1 with purified fibrillin microfibrils was formed and analyzed using STEM mass mapping. (i) STEM images of fibrillin microfibrils with and without LTBP-1. Scale bars, 100 nm. (ii) Scatter plot of the mass per microfibril repeat of fibrillin microfibrils (fib) with and without LTBP-1. The mean mass of a fibrillin repeat was 3,055 ± 36.7 kDa (n = 75 from ten images). In complex with LTBP-1, the mass was 3,405 ± 54.43 kDa (n = 69 from 11 images). The data represent means ± s.d. Statistical significance was determined by unpaired two-tailed t-test (****P < 0.0001). (iii) Trace of the mass per unit length (MUL) across the fibrillin repeat showing that there is a gain in mass at the bead region of the microfibril in the presence of LTBP-1. Each trace is an average of 50 periods (ten measurements from each of five images).

