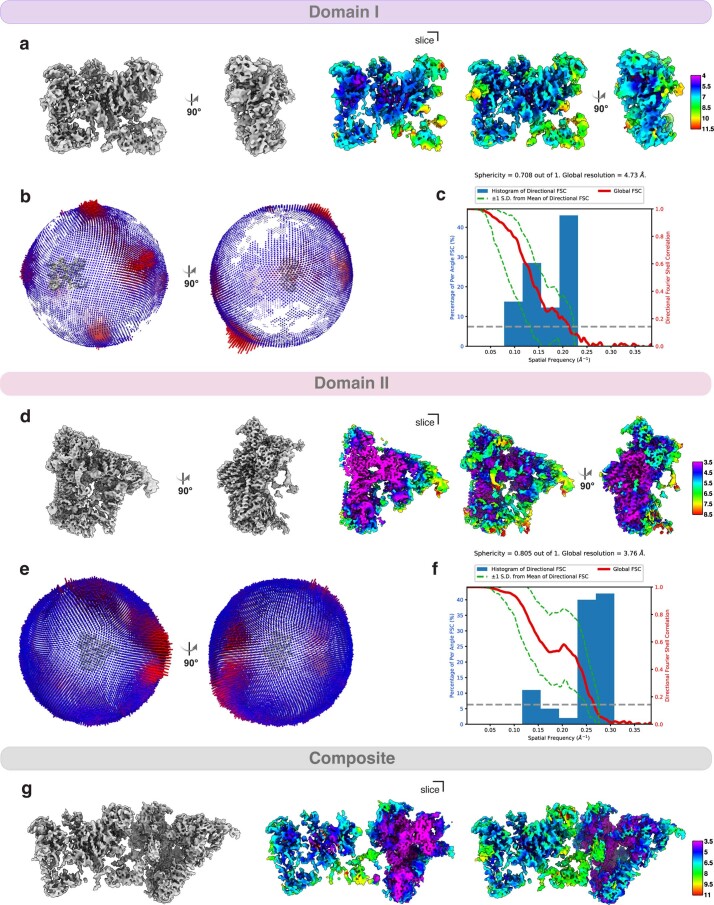
Extended Data Fig. 4. Local resolution estimation and 3DFSC curves of the Noc1-Noc2 RNP.
Local resolution estimation displayed in rainbow color on the cryo-EM map of (a) domain I, (d) domain II, (g) composite map shown in 2 different views as calculated by cryoSPARC. Euler angular distribution of the particles from the final refinement of (b) domain I, (e) domain II. 3DFSC curve for (c) domain I and (f) domain II reconstructions calculated by cryoSPARC.

