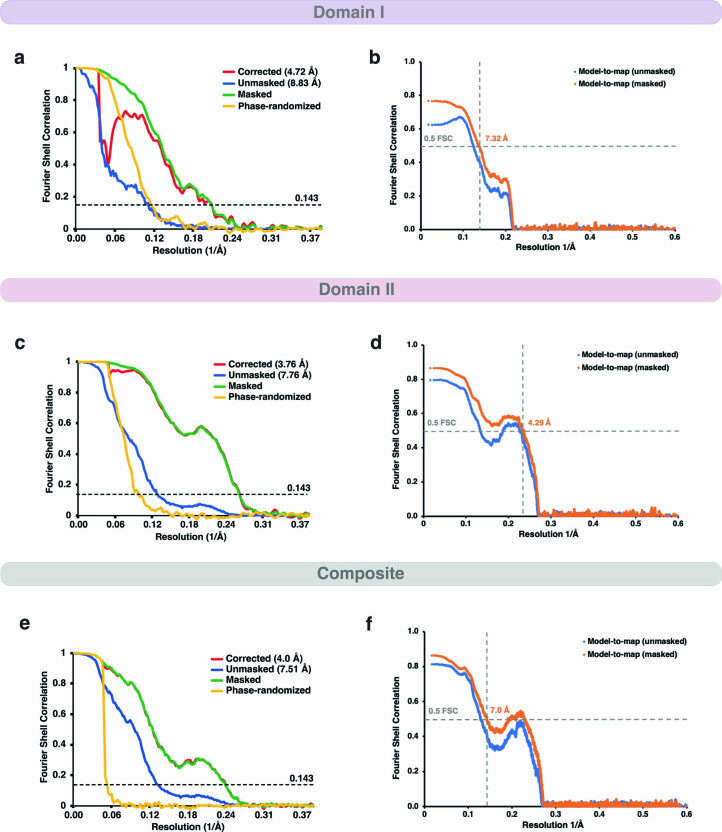
Extended Data Fig. 5. Solvent-corrected FSC curves and Map-to-Model correlation.
Solvent-corrected FSC curves for (a) domain I, (c) domain II and (e) composite map as calculated in Relion 3.0. Reported resolutions were determined at FSC = 0.143 upon post-processing in Relion 3.0. Map-to-model correlation between (b) domain I map and model, (d) domain II map and model and (f) composite map and model with resolutions reported at FSC = 0.5.

