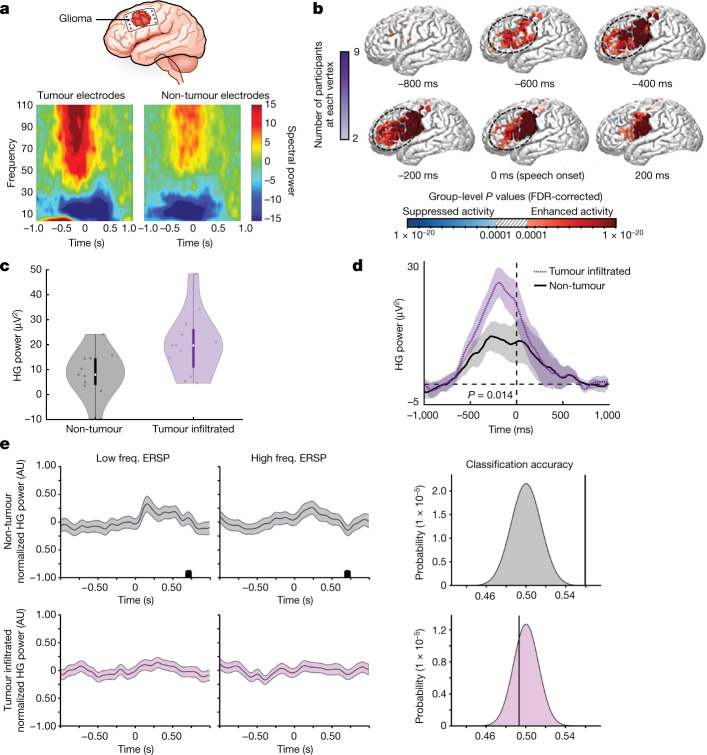
Fig. 1. High-grade gliomas remodel long-range functional neural circuits.
a, In participants with dominant hemisphere glioblastomas, we applied subdural ECoG over the posterior lateral frontal cortex during an audiovisual speech initiation task to assess circuit dynamics. Spectral data show the expected pattern of HGp increasing above 50 Hz in addition to clear separation of frequencies across tumour and non-tumour electrodes. b, The posterior lateral frontal cortex (outlined area) time series of HGp within tumour-infiltrated cortex between −600 ms and speech onset (0 ms). c, High-gamma (HG) recordings from averaged electrodes within each patient, while averaging the effect across the sampled region of cortex for an individual showing greater HG power within electrodes overlying tumour-infiltrated cortex (n = 14 patients, F1,21 = 25.562, P = 0.00005). Data are median (centre dot), first to third quartiles (bars) and the minimum and maximum points (whiskers). d, Electrodes were compared between non-tumour and tumour-infiltrated regions; the false-discovery rate (FDR)-corrected HGp demonstrates task-relevant hyperexcitability (P = 0.016). Data are mean ± s.e.m. e, Event-related spectral perturbations (ERSPs) during a naming task for low-frequency words (low freq., left column) and high-frequency words (high freq., middle column) in normal-appearing non-tumour regions (top row) and glioma-infiltrated (bottom row) cortex. Signals from high-frequency word trials were able to be decoded above chance in normal-appearing cortex (mean accuracy = 0.56, P = 0.000089) but not in glioma-infiltrated cortex (mean classifier accuracy = 0.49, P = 0.72) using a regularized logistic regression classifier with leave-one-participant-out cross-validation (right column). Data are mean ± 95% confidence interval. AU, arbitrary units. For b–d, statistical analysis was performed using two-sided linear mixed-effects models (b–d), and corrections for multiple comparisons were performed using FDR adjustment (b and d). For e, P values were determined using two-tailed Student’s t-tests with Bonferroni multiple-comparison correction for the number of timepoints (left, ERSP) and one-sided Z-tests (right, classification accuracy).

