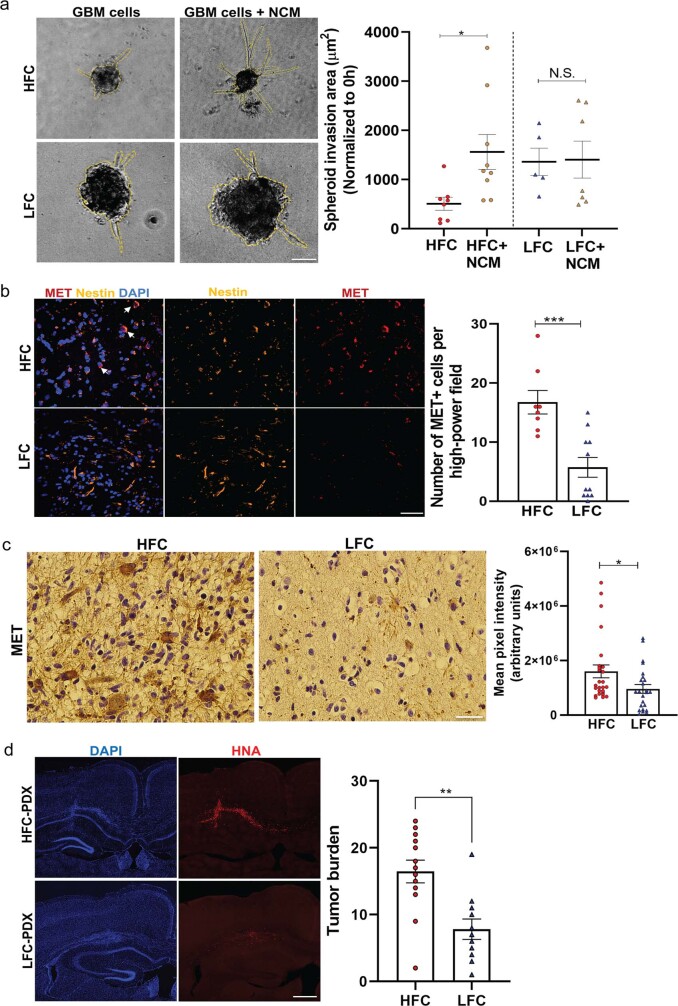
Extended Data Fig. 9. Activity-dependent invasion of TSP-1 positive HFC cells.
a, 3D spheroid invasion assay showing representative micrographs imaged 24 h after addition of invasion matrix. Analysis includes quantification of mean spheroid invasion area normalized for each sample to the initial (0 h) spheroid area (HFC: n = 11; HFC + NCM: n = 16; LFC: n = 5; LFC + NCM: n = 6 spheroids, 1 per group; P = 0.02). Scale bar, 200 µm. Data presented as mean ± s.e.m. P values determined by two-tailed Student’s t-test. b, Representative confocal images of primary patient-derived HFC and LFC tissues showing MET-positive glioma cells (white arrows). Red, MET; orange, Nestin (HFC/LFC-GBM cells); blue, DAPI. Scale bar, 30 µm. Quantification of MET-positive glioma cells per high-power field (HFC: n = 8; LFC: n = 11, 3 per group; P = 0.0005). c, Representative immunohistochemistry images of MET staining in HFC and LFC tissues demonstrate increased tissue level protein expression (HFC: n = 26; LFC: n = 24 regions, 4 per group; P = 0.0329). Scale bar, 50 µm. Data presented as mean ± s.e.m. P values determined by two-tailed Student’s t-test. d, Representative confocal images showing the diffuse infiltrative pattern of HFC cells in the hippocampus in comparison to the LFC cells. Quantification of tumour burden of HFC and LFC hippocampal xenografts using rank order analysis (HFC: n = 13; LFC: n = 11 regions; P = 0.002). Scale bar, 100 µm. Data presented as mean ± s.e.m. P value determined by two-tailed Mann-Whitney test. *P < 0.05; **P < 0.01; ***P < 0.001; NS, not significant.

