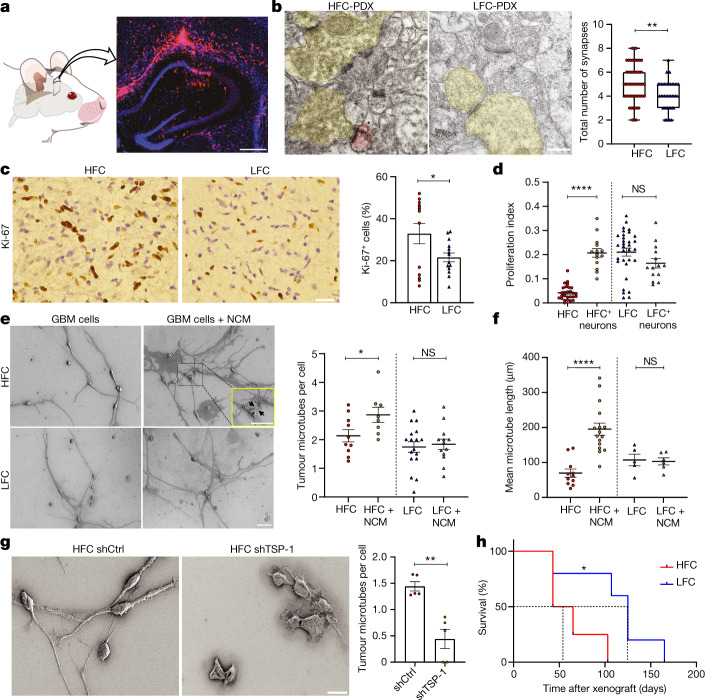
Fig. 3. High-grade gliomas exhibit bidirectional interactions with HFC brain regions.
a, Representative micrograph showing RFP-labelled glioblastoma xenografted into the mouse hippocampus. Scale bar, 500 µm. b, Immuno-electron microscopy analysis of HFC or LFC cell xenografts. The asterisk denotes immuno-gold particle labelling of RFP. Postsynaptic density in RFP+ tumour cells (pseudocoloured red), synaptic cleft and clustered synaptic vesicles in apposing presynaptic neuron (pseudocoloured yellow) identify both neuron–glioma synapses in HFC-PDX (left) and neuron–neuron synapses in LFC-PDX (right). Quantification of the total number (neuron–neuron combined with neuron-glioma) of synapses per field of view in HFC/LFC xenografts. n = 4 mice per group. P = 0.0019. Scale bar, 1,000 nm. Data are median (centre line), with first and third quartiles (box limits) and the minimum and maximum points (whiskers). c, Representative immunohistochemistry images in glioblastoma tissues demonstrate increased Ki-67 protein expression in HFC samples. n = 13 (HFC) and n = 14 (LFC) regions, 4 per group. P = 0.04. Scale bar, 50 µm. d, Glioblastoma cells from HFC tissues show a marked increase in the proliferative index when co-cultured with mouse hippocampal neurons. n = 27 (HFC), n = 14 (HFC + neurons), n = 32 (LFC) and n = 14 regions (LFC + neurons), 3 per group. e, SEM images of HFC and LFC cells cultured in the presence or absence of neuronal conditioned medium (NCM) shows tumour microtubes (TMTs) that connect neighbouring cells through cytoplasmic extensions. Quantification of TMTs per cell. n = 10 (HFC), n = 8 (HFC + NCM), n = 17 (LFC) and n = 13 (LFC + NCM) regions, 2 per group. P = 0.0455. Scale bars, 20 µm (full fields) and 10 µm (magnified view). f, Quantification of the mean microtube length per spheroid. n = 11 (HFC), n = 16 (HFC + NCM), n = 5 (LFC) and n = 6 (LFC + NCM) spheroids, 1 per group. P = 0.000011. g, Representative SEM images showing TMTs and quantification of TMTs per cell from HFC shCtrl and HFC shTSP-1 conditions. n = 5 regions, 2 per group. P = 0.0012. Scale bar, 20 µm. h, Kaplan–Meier survival curves of mice bearing HFC or LFC xenografts. n = 4 (HFC) and n = 5 (LFC). P = 0.03. Data are mean ± s.e.m. (b–h). P values were determined using two-tailed Student’s t-tests (b–g) and two-tailed log-rank analysis (h).*P < 0.05, **P < 0.01, ****P < 0.0001; NS, not significant.

