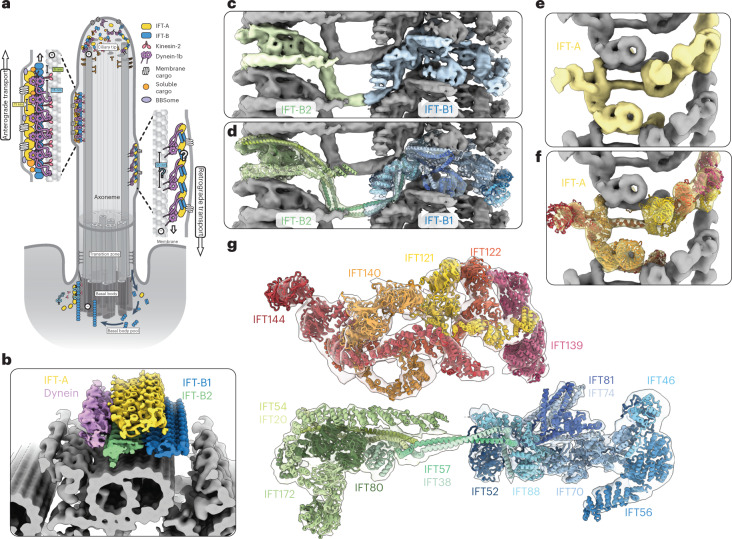
Fig. 1. An overview of the anterograde IFT train structure.
a, Cartoon model of IFT within a cilium. Anterograde trains form at the base of the cilium (basal body) and carry cargo through the diffusion barrier (transition zone) and to the tip. Here, they remodel into retrograde trains that carry their cargos back to the basal body for recycling. b, The new subtomogram averages lowpass filtered and colored by complex (yellow, IFT-A; blue, IFT-B1; green, IFT-B2; purple, dynein), docked onto a cryo-ET average of the microtubule doublets found in motile cilia. One repeating unit is highlighted in each complex with darker shading. c, The new subtomogram averages for IFT-B1 (blue) and IFT-B2 (green), displayed together as a composite. One repeating unit is highlighted in color, with the adjacent repeats in gray. d, Equivalent to c, but with the highlighted repeat now shown partially transparent and our molecular model of IFT-B docked in. e, The new subtomogram average of IFT-A, with one repeating unit shown in yellow and adjacent repeats in gray. f, Equivalent to e, but with the highlighted repeat now shown partially transparent and our molecular model of IFT-A docked in. g, Our molecular model of one repeating unit of IFT-A and IFT-B in the anterograde train, shown in cross-section as if looking down the microtubule. The partially transparent density for four maps is shown: IFT-B2 and IFT-A, with the main IFT-B1 average combined with a masked refinement of the region containing IFT56 (IFT-B1 tail; Extended Data Fig. 2a), since this region is more flexible relative to the core.

