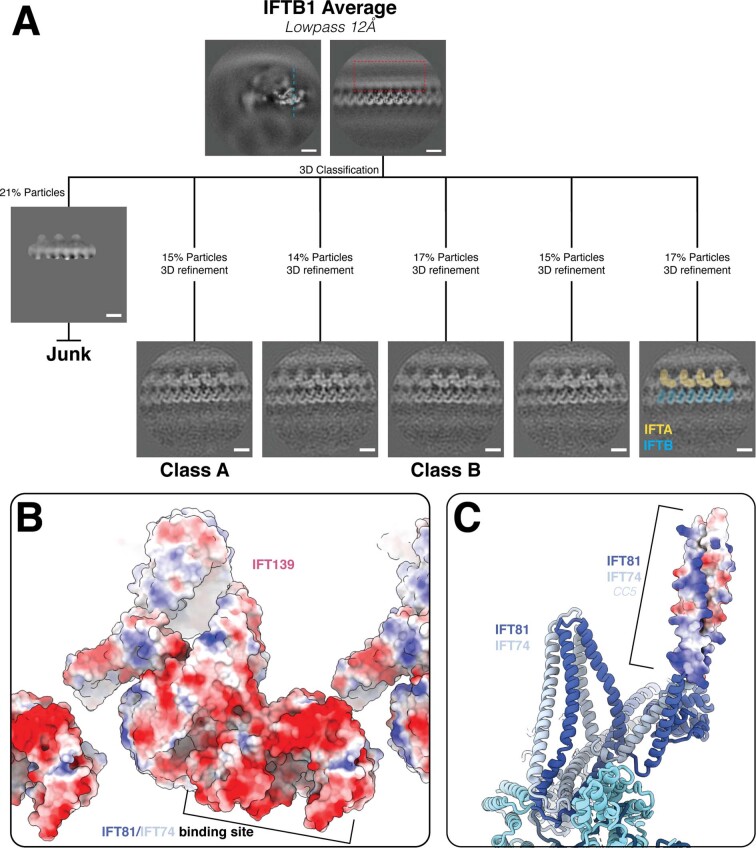
Extended Data Fig. 10. Classification of synchronous IFT-A and IFT-B averages.
a, Processing workflow of the classification of the IFT-B average to generate the classes in Fig. 5 that show synchronous IFT-A and IFT-B. Scale bars = 10 nm. b, Surface charge representation of IFT139 shows that the IFT81/74 binding site is strongly negatively charged. c, Surface charge representation of IFT81/74 CC5 shows that it is positively charged, facilitating its interaction with IFT139.

