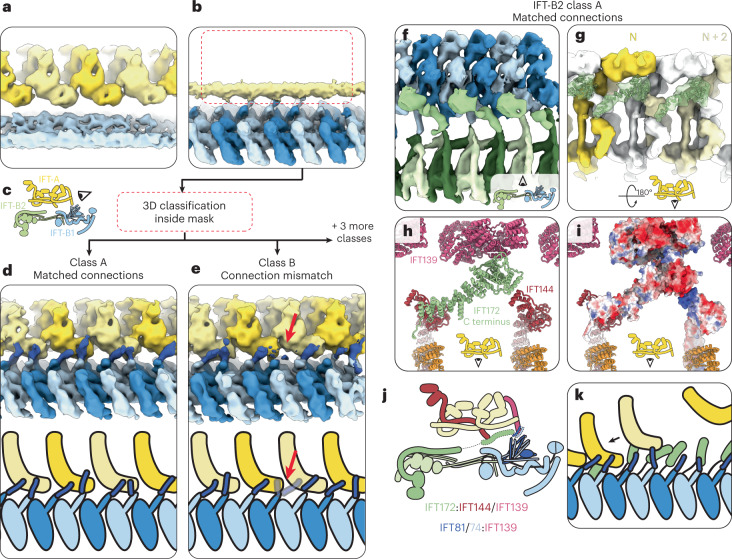
Fig. 5. IFT-A and IFT-B are connected at two points.
a, The 21 Å IFT-A average covering three repeats, unmasked to show that IFT-B (light blue) is averaged out with respect to IFT-A (alternating yellow) due to peridocity mismatch. b, The IFT-B1 average filtered to 12 Å and unmasked, to show that IFT-A (yellow) is averaged out with respect to IFT-B1 (alternating blue) due to periodicity mismatch. The red box indicates the location of the mask used for subclassification to generate the classes in d and e. c, Cartoon depicting the view in a, b, d and e. d, After classification of the IFT-A region in the IFT-B1 average, we find classes where IFT-A (alternating yellow) and IFT-B (alternating blue) are in sync. We see a new density (dark blue) linking IFT-B to IFT-A, which we designate as CC5 of IFT81/74. Bottom, cartoon representation of the density. e, A second class shows how the IFT81/74 connections (dark blue) adapt to the periodicity mismatch between IFT-A (alternating yellow) and IFT-B (alternating blue), by switching register with respect to IFT-A at the red arrow. Bottom, cartoon representation of the density. f, A top view of class A from classification of the IFT-A region in the IFT-B2 average. Inset, cartoon view. IFT-B1 (alternating light/dark blue) and IFT-B2 (alternating light/dark green) are joined by a new, unmodeled density corresponding to the C terminus of IFT172 (lime green). g, The same class as f, rotated 180° to view the same IFT172 density (lime green and transparent, with the AlphaFold2 model docked) interacting with IFT-A. The IFT-A complex is colored to highlight that the connecting density connects nonadjacent neighbors. Inset, cartoon view. h, The same view as in g, showing the AlphaFold2 IFT172 C terminus model (lime green) docked into the density along with our IFT-A model. IFT172 bridges the gap between IFT144 and IFT139. i, The same view as in h, with IFT172, IFT144 and IFT139 shown with surface charge depiction. The negatively charged IFT172 C terminus can make favorable ionic interactions with the positively charged IFT144 C terminus. j, Cartoon representation of the overall anterograde train structure, showing the two points of connection (dotted outlines). k, Cartoon representation depicting the proposed role of the flexible tethers in recruiting IFT-A complexes to nascent IFT trains.

