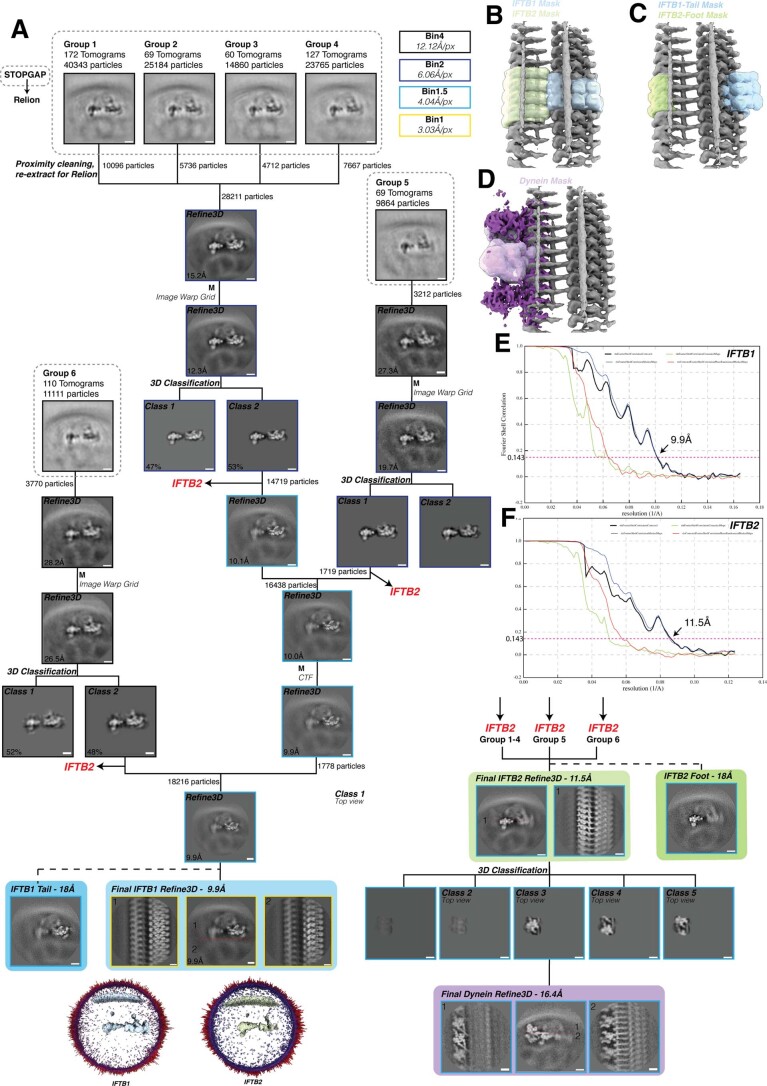
Extended Data Fig. 2. Processing diagram for IFT-B subtomogram averaging.
a, Workflow depicting the steps involved in averaging the IFT-B1 and IFT-B2 complexes. Processing started in STOPGAP (areas in dotted black line) before proceeding to Relion. The level of binning at each stage is indicated by the outline of the box (colour code top right). All scale bars=10 nm. b, The solvent masks used to refine IFT-B1 (blue) and IFT-B2 (green) separately from each other. c, The solvent masks used to refine the extremities of the IFT-B1 and IFT-B2 complexes, which are poorly resolved when using the masks in B. d,The solvent mask used to classify and refine dynein from IFT-B2. e, Fourier Shell Coefficient (FSC) curve of the IFT-B1 average, as a measure of map resolution. f, FSC curve of the IFT-B2 average.

