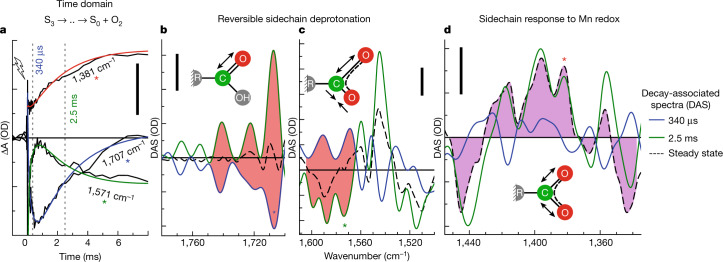
Fig. 2. Oxygen-evolution transition traced by FTIR.
a, IR time traces at selected wavenumbers, demonstrating the delayed onset of O–O bond formation (1,381 cm−1) and reversible changes assignable to transient sidechain deprotonation (1,571 cm−1 and 1,707 cm−1). The corresponding wavenumbers in the spectra in b–d are marked with coloured asterisks. b–d, DAS corresponding to the proton release phase ( = 340 µs, blue line) and the oxygen-evolution phase ( = 2.5 ms, green) as well as the steady-state difference spectrum of the S3 → S0 + O2 transition (dashed black line). Red areas b,d mark inverted 340 µs DAS and 2.5 ms DAS, indicating reversible behaviour; purple shaded areas in c highlight the similarity of the 2.5 ms DAS and the steady-state spectrum, in line with the assignment to non-transient changes in Mn oxidation state. Scale bars, 50 µOD.

