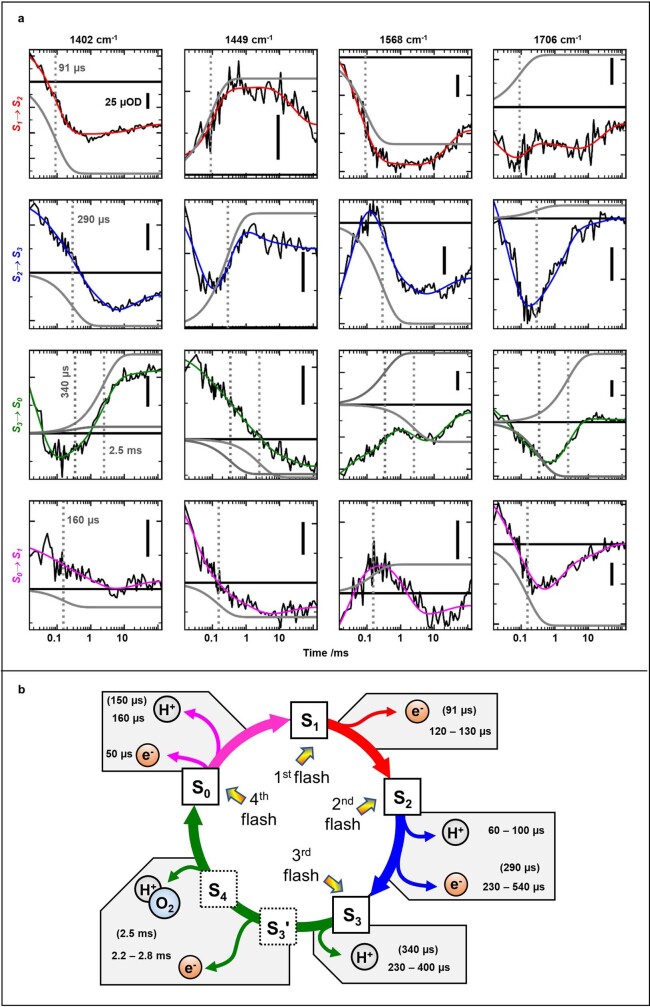
Extended Data Fig. 2. Select infrared transients demonstrating that previously identified rate constants are resolved also in the step-scan FTIR experiment.
a. Transients at select wavenumbers for the four deconvolved S-state transitions. These transients are shown to demonstrate that previously identified reaction kinetics are recoverable in this work. Smooth colored lines represent multi-exponential simulation (least-square fit) of the IR transients. Grey dashed lines mark the identified time constants while grey transients show the respective simulated contributions to the total transient. In each panel, the respective pre-flash level is indicated by a black line. The complete set of simulation parameters can be found in Supplementary Table 2. b. S-state cycle with previously determined time constants values (see Supplementary Table 3) and those found in this work (in parenthesis).

