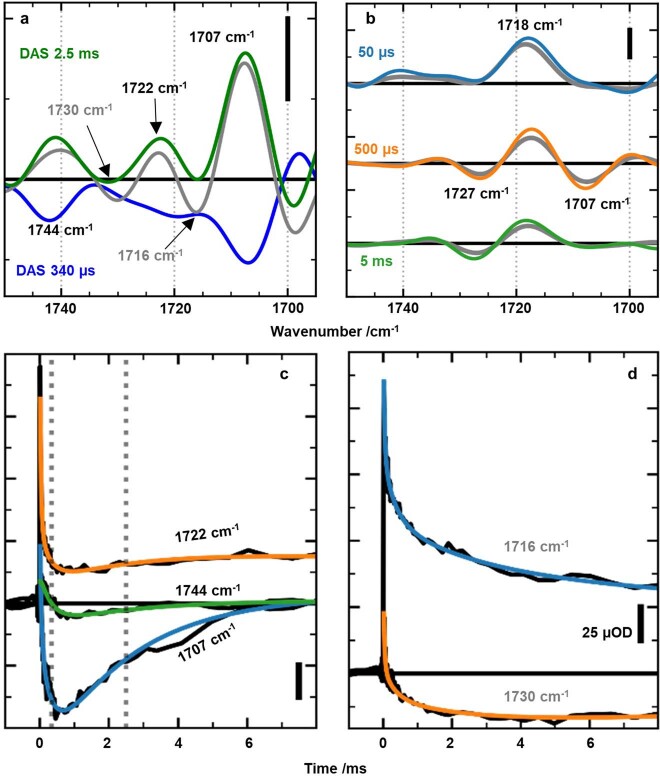
Extended Data Fig. 4. Carbonyl band spectra and IR transients between 1695 and 1750 cm−1 for the oxygen-evolution transition (S3->S4->S0).
a. Decay-associated spectra of the 340 µs component and of the 2.5 ms component, the latter before (grey line) and after (green line) correction for acceptor side contributions. The acceptor side correction results in three positive peaks for the 2.5 ms component, indicating that band shift cannot explain these three peaks at 1730 cm−1, 1722 cm−1 and 1707 cm−1. b. Spectra at selected times for the oxygen-evolution transition induced by the 3rd laser flash before (grey lines) and after (colored lines) deconvolution. The high level of similarity indicates that in this spectral region the deconvolution correction is uncritical as it hardly modifies the 3rd-flash data. c. Transients displaying reversible behaviour of the 340 µs and 2.5 ms phases reflecting carboxylate deprotonation and reprotonation. d. Transient changes assignable to acceptor side contributions. All scale bars correspond to 25 µOD. For details on correction for acceptor side contributions and S-state deconvolution, see Supplementary Information.

