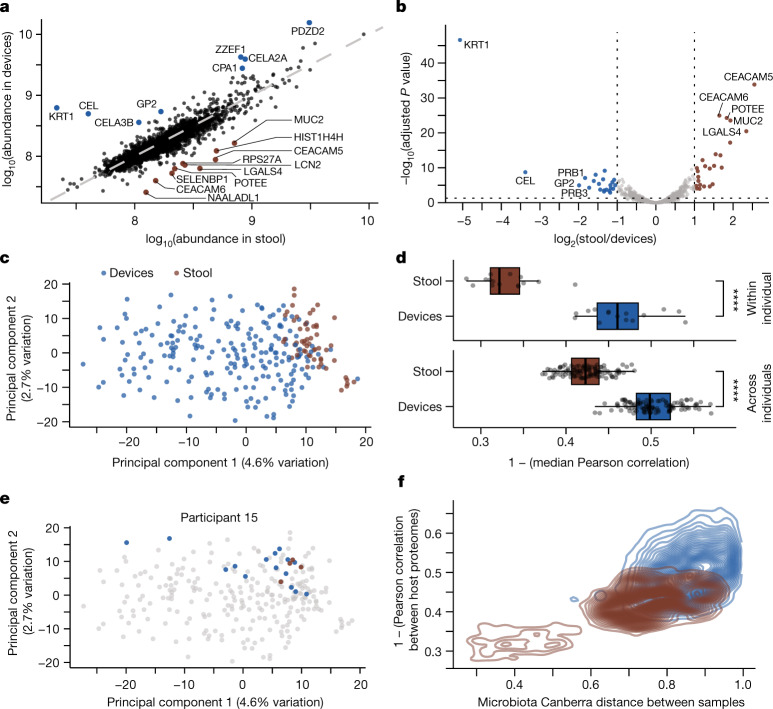
Fig. 4. Human protein abundance differs between stool and intestinal samples.
a, Median log10(abundance) of human proteins in stool samples (n = 56) compared with intestinal samples (n = 212). b, log2(fold change) of each protein abundance in stool relative to intestinal samples. A two-sample modified t-test with Benjamini–Hochberg correction was used. Proteins with absolute log2(fold change) > 1 and P < 0.05 are coloured on the basis of sample type and enrichment. c, PCA of normalized human protein abundance shows separation between intestinal and stool samples (n = 212 and 56, respectively). d, Human proteome composition varies significantly more between intestinal samples (n = 212) than between stool samples (n = 56), both within (top) and across (bottom) participants. Top, each circle is the median Pearson correlation coefficient of all sample pairs for a given participant. Bottom, each circle is the median of all correlation coefficients between all pairs of samples from any two participants (n = 105 for each intestinal and stool sample). ****P ≤ 0.0001, Bonferroni-corrected two-tailed Wilcoxon rank-sum test. e, PCA from c highlighting the clustering of intestinal and stool samples from participant 15 (n = 15 and 4, respectively). f, Canberra distance between microbiota compositions was higher in samples with less similar human proteomes for all sample pairs of a given type (n = 20,706 pairwise comparisons for devices, n = 1,485 pairwise comparisons for stool).

