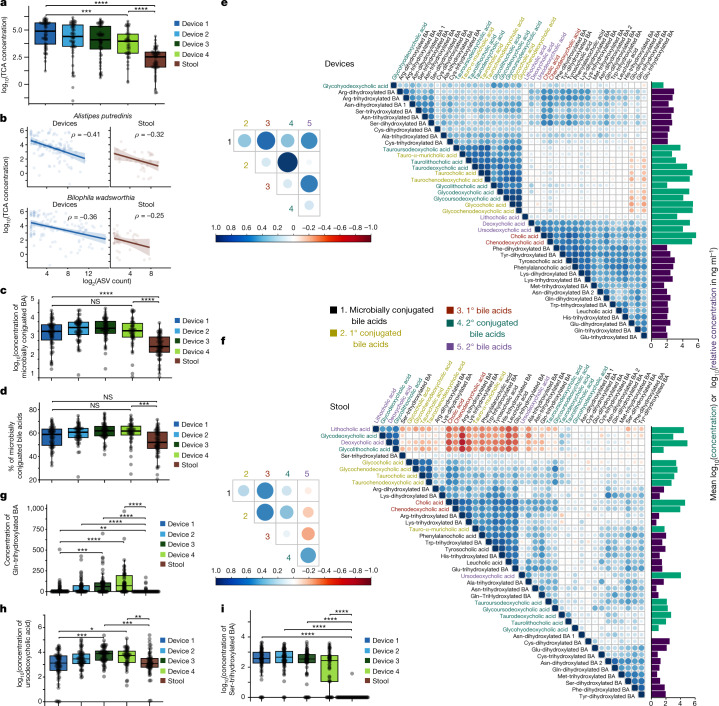
Fig. 6. Bile acid relationships in intestines and stool.
a, TCA concentration decreases along the intestinal tract. Shown are log10-transformed concentrations. Device type 1 to 4, P = 10−3; device type 1 to stool, P = 6.2 × 10⁻¹⁴; device type 4 to stool, P = 5.5 × 10⁻⁷. b, log2(read count) of an A. putredinis ASV and a B. wadsworthia ASV was negatively correlated (P = 0.0020 and P = 0.0042, respectively) with TCA concentration. Correlations were weaker in stool samples (P = 0.36 and P = 0.56, respectively). Correlations are Spearman correlations with Benjamini–Hochberg correction. Only ASVs with P < 0.01 after correction in devices are shown. Points are individual intestinal (n = 210) or stool (n = 56) samples for which both 16S rRNA sequencing and metabolomics data were available. c, The concentration of microbially conjugated bile acids is significantly higher in intestinal samples than in stool samples. The concentration did not differ significantly across device types. Device type 1 to 4, P = 1; device type 1 to stool, P = 3.5 × 10⁻⁶; device type 4 to stool, P = 1.6 × 10⁻⁶. d, The percentage of microbially conjugated bile acids increases along the intestinal tract and was significantly higher in intestinal samples than in stool. Device type 1 to 4, P = 0.40; device type 1 to stool, P = 0.23; device type 4 to stool, P = 8.0 × 10⁻⁴. e,f, Correlations between bile acid profiles differ between intestinal (e) and stool (f) samples. Shown are Pearson correlation coefficients using log10-transformed concentrations. Horizontal bars show the mean absolute concentration (green) or relative concentration (purple) (Methods). Bile acid ordering was determined by hierarchical clustering. Insets show the Pearson correlation coefficient for aggregated classes. g–i, Concentration of the respective bile acid across devices and stool. P values from top to bottom for g: 4.3 × 10⁻⁹, 7.5 × 10⁻⁹, 5.1 × 10⁻⁷, 7.0 × 10⁻³, 1.8 × 10⁻⁴ and 6.5 × 10⁻⁴. P values from top to bottom for h: 0.001, 5.8 × 10⁻⁵, 0.023 and 1.4 × 10⁻⁴. P values from top to bottom for i: 5.9 × 10⁻¹³, 1.5 × 10⁻¹⁶, 8.5 × 10⁻²⁰ and 6.2 × 10⁻¹⁹. All boxplots show the median and first and third quartiles. Points are individual intestinal (n = 58, 56, 57 and 47 for device types 1–4, respectively) or stool (n = 57) samples, unless otherwise indicated. Concentrations in ng ml–1 (intestinal) or ng g–1 (stool). *P ≤ 0.1, **P ≤ 0.01, ***P ≤ 0.001, ****P ≤ 0.0001, Bonferroni-corrected two-sided Wilcoxon rank-sum test.

