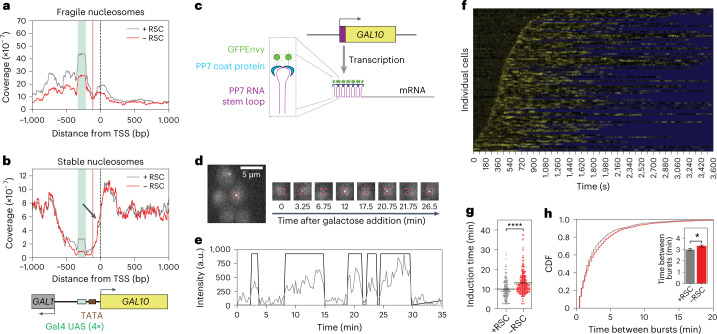
Fig. 1. Remodeling of GAL10 promoter nucleosomes at the UASs and the TSS by RSC affects induction time and time between bursts.
a, MNase-seq analysis of fragile nucleosomes in the GAL10 promoter region showed a reduced coverage of fragile nucleosomes upon RSC depletion using anchor-away of the catalytic subunit Sth1 by 60 min rapamycin treatment. b, MNase-seq analysis of stable nucleosomes in the GAL10 promoter region. The black arrow indicates a small shift of the +1 nucleosome into the NDR upon RSC depletion. MNase plots in a and b show one representative replicate out of two experiments. c, Schematic of PP7 RNA labeling to visualize GAL10 transcription in real-time. d, Fluorescence signal of an individual TS in a representative cell over time. Red box: location of GAL10 TS. Representative example out of 143 cells. e, Quantification of TS intensity over time of the cell in (d) (gray) and binarization (black). f, Heatmap of the TS intensity in n = 143 cells (rows) in the presence of RSC. Yellow: fluorescence intensity of TS; blue: region excluded from analysis. g, Cells that were depleted of RSC (red) showed an increased GAL10 induction time compared to the nondepleted cells (gray). P = <10−15. h, Cells that were depleted of RSC (red) showed an increased time between the burst of GAL10 transcription compared to the nondepleted cells (gray). Data are presented as cumulative distribution. Inset: data presented as mean values ± s.d. based on 1,000 bootstrap repeats. P = 0.028. The significance in g and h (inset) was determined by two-sided bootstrap hypothesis testing53; *, P < 0.05, ****, P < 0.00005.

