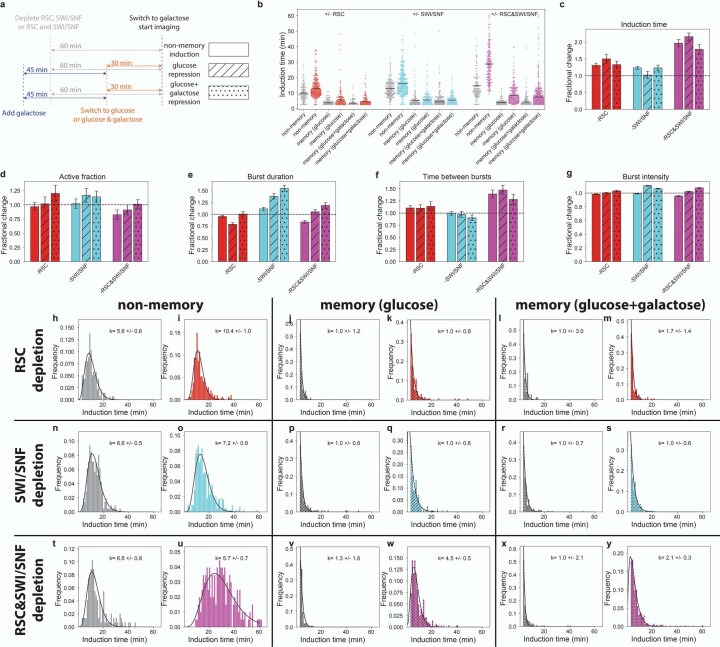
Extended Data Fig. 4. Transcriptional re-induction of GAL10 shows increase in the number of activation steps upon RSC and SWI/SNF depletion.
a Schematic explaining re-induction experiments. For non-memory induction, cells were grown in raffinose. For memory experiments, cells were primed by adding galactose for 45 min and subsequently washed and resuspended in the appropriate repression sugar 30 min before imaging. As in all experiments, rapamycin or DMSO was added for depletion 60 min prior to galactose addition and imaging. b GAL10 induction time in memory and non-memory conditions, upon depletion of RSC, SWI/SNF or both RSC and SWI/SNF. c–g Change in (c) induction time, (d) active fraction, (e) burst duration, (f) time between bursts and (g) burst intensity upon depletion of RSC, SWI/SNF or both RSC and SWI/SNF. Data in (c) and (e)-(g) are presented as the fractional change based on mean values + /- standard deviation based on 1000 bootstrap repeats. Data in (d) is presented as the fractional change based on number of active and inactive cells + /- propagated statistical errors in the number of active and inactive cells. h–y Distribution of induction time in memory or non-memory conditions as indicated on top in presence (grey) or absence (red, cyan or magenta) of remodeler indicated on the left. Black line: least-squares fit with Gamma distribution; inset: shape parameter k obtained from fit. Error obtained from least-squares fit. A k-value not significantly different from 1 indicates a single rate-limiting step, while k > 1 indicates multiple rate-limiting steps. Without remodeler depletion, re-induction after memory with glucose shows a single rate-liming step (v),(x), which increases to multiple rate-limiting steps after combined RSC&SWI/SNF depletion (w),(y).

