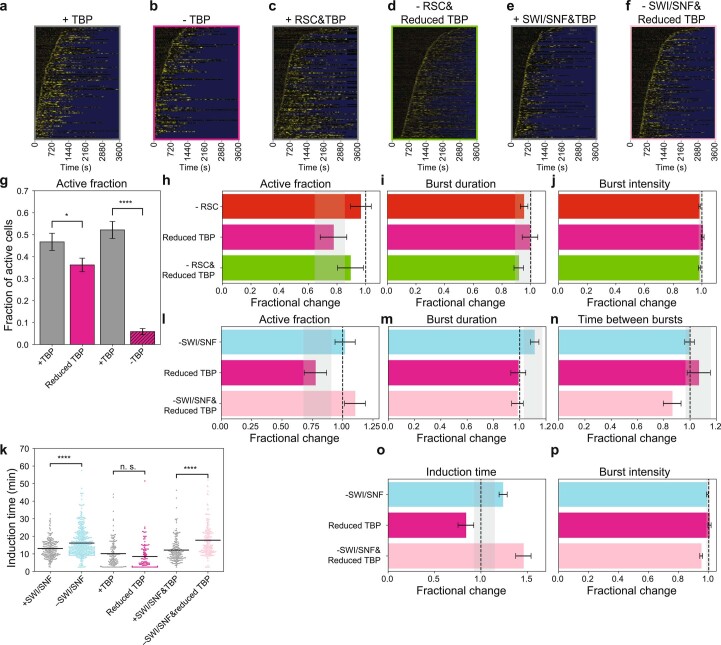
Extended Data Fig. 5. Transcription dynamics upon perturbed nucleosomes around the TATA, by depletion of TBP and RSC or SWI/SNF.
a–f Heatmap of TS intensity in (a) N = 139, (b) N = 120, (c) N = 122, (d) N = 340, (e) N = 179 and (f) N = 175 cells (rows) in the presence or absence of indicated factors. Yellow: TS fluorescence intensity; blue: region excluded from analysis. g The fraction of cells that activated during 1 hour of imaging when depleting TBP fully (-TBP, both copies tagged for depletion) or partially (reduced TBP, one copy tagged for depletion) using anchor-away. Data is the fraction based on the number of active and inactive cells + /- propagated statistical errors in these numbers. Significance determined by two-sided Fisher’s exact test; *: p < 0.05; ****: p < 0.00005. p-values: +TBP vs partial TBP 0.0062; +/-TBP 7.7 10−42. h–j The fraction of (h) cells that activated during 1 hour of imaging, (i) the burst duration and (j) the burst intensity, in -RSC&Reduced TBP were as expected based on their individual depletions. k SWI/SNF and simultaneous TBP and SWI/SNF depletion showed increased GAL10 induction time. Significance in (n) determined by two-sided bootstrap hypothesis testing53; n.s.: not significant; ****: p < 0.00005. p-values: +/- SWI/SNF < 10−15; +TBP vs partial TBP < 10−15; +SWI/SNF&TBP vs -SWI/SNF&partial TBP < 10−15. l–p SWI/SNF and simultaneous TBP and SWI/SNF depletion showed (k) increased induction time of GAL10. (l) The fraction of cells that activated during 1 hour of imaging, (m) the burst duration, (n) the time between bursts, (o) the induction time and (p) the burst intensity for single and double depletion of SWI/SNF and reduced TBP. (h)-(j), (l)-(p) Data for active fraction is the fractional change based on number of active and inactive cells + /- propagated statistical errors in the number of active and inactive cells. Data for other parameters are the fractional change based on mean values + /- standard deviation based on 1000 bootstrap repeats. Grey bar: expected effect based on dynamic epistasis analysis.

