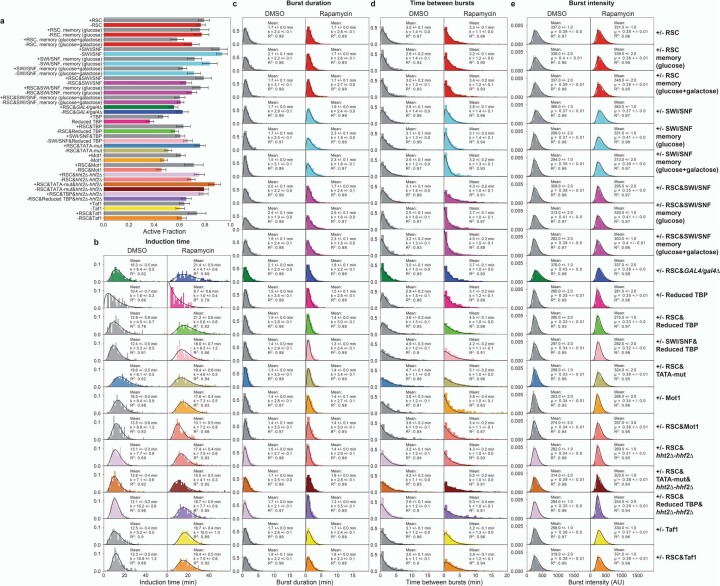
Extended Data Fig. 6. Distributions of the transcriptional bursting parameters for the strains used in this study.
a Active fractions for indicated strains used in this study. Error bars are propagated statistical errors in the number of active and inactive cells. b Distributions of the induction time for indicated strains in non-depleted (DMSO, left) or depleted (rapamycin, right) conditions. Black line: fit with Gamma distribution; inset: mean with standard deviation based on 1000 bootstrap repeats, shape parameter k with error obtained from least-squares fit and R2 of the fit. For the induction time distributions of +/− RSC, +/− SWI/SNF and +/− RSC&SWI/SNF in normal and memory conditions, see Extended Data Fig. 4. c Distributions of the burst duration for indicated strains in non-depleted (DMSO, left) or depleted (rapamycin, right) conditions. Black line: fit with Gamma distribution; inset: mean with standard deviation based on 1000 bootstrap repeats, shape parameter k with error obtained from least-squares fit and R2 of the fit. d Distributions of the time between bursts for indicated strains in non-depleted (DMSO, left) or depleted (rapamycin, right) conditions. Black line: fit with Gamma distribution; inset: mean with standard deviation based on 1000 bootstrap repeats, shape parameter k with error obtained from least-squares fit and R2 of the fit. e Distributions of the burst intensity for indicated strains in non-depleted (DMSO, left) or depleted (rapamycin, right) conditions. Black line: fit with log-normal distribution; inset: mean with standard deviation based on 1000 bootstrap repeats, μ with error obtained from least-squares fit and R2 of the fit.

