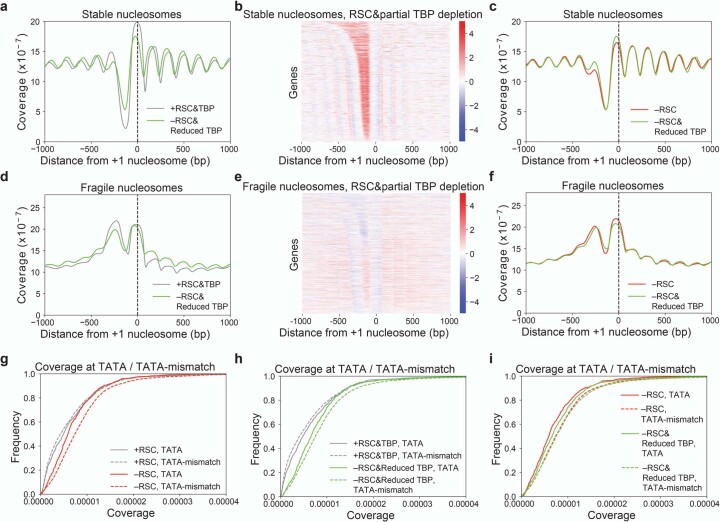
Extended Data Fig. 7. Genome-wide changes in nucleosome coverage upon depletion of RSC and TBP.
a, d Metagene MNase-seq analysis of (a) stable and (d) fragile nucleosomes upon RSC and TBP depletion, averaged over all genes as annotated by63, aligned at the location of the +1 nucleosome (black dashed line). b, e Heatmap of the log2-fold-change of depletion/non-depleted in nucleosome coverage of (b) stable and (e) fragile nucleosomes at all genes as annotated by63, sorted by NDR width and aligned at the location of the +1 nucleosome, upon RSC and TBP depletion. c, f Overlay of metagene MNase-seq profiles of (c) stable and (f) fragile nucleosomes upon RSC depletion and simultaneous RSC and TBP depletion, averaged over all genes as annotated by63, aligned at the location of the +1 nucleosome (black dashed line). g Cumulative distribution of coverage of stable nucleosomes in TATA or TATA-mismatch elements genome-wide upon depletion of RSC, showing a larger increase in coverage at TATA-mismatch elements than at a TATA-elements. h Cumulative distribution of coverage of stable nucleosomes in TATA or TATA-mismatch elements genome-wide upon simultaneous depletion of RSC and TBP. i Overlay of cumulative distributions of coverage of stable nucleosomes in TATA or TATA-mismatch regions genome-wide upon depletion of RSC or simultaneous depletion of RSC and TBP, showing that partial TBP depletion specifically increased the coverage at TATA-elements. Shown is one representative replicate out of two experiments for all plots.

