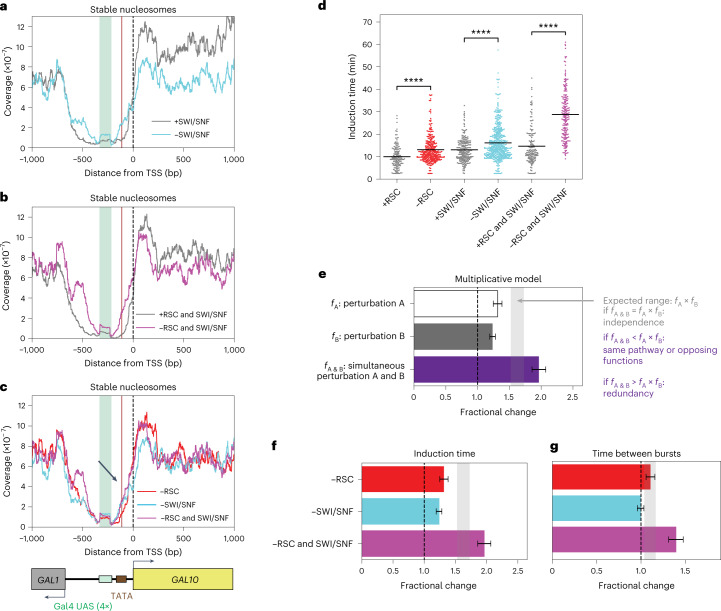
Fig. 2. Partially redundant remodeling of nucleosomes by RSC and SWI/SNF at the TATA and TSS synergistically affects the induction time and time between bursts.
a, MNase-seq analysis in the GAL10 promoter region showed higher coverage of stable nucleosomes around the TATA upon depletion of SWI/SNF by anchor-away of the catalytic subunit Swi2. b, MNase-seq analysis of stable nucleosomes in the GAL10 promoter region showed higher coverage at the TATA and around the TSS upon simultaneous depletion of RSC and SWI/SNF than depletion of either RSC or SWI/SNF individually. c, Overlay of MNase-seq analysis of stable nucleosomes in the GAL10 promoter region upon depletion of RSC, SWI/SNF and simultaneous depletion of RSC and SWI/SNF showed increased coverage (black arrow). MNase plots in a–c show one representative replicate out of two experiments. d, Cells that were depleted of RSC and/or SWI/SNF (red, cyan, magenta) had an increased GAL10 induction time compared to the nondepleted cells (gray). Significance determined by two-sided bootstrap hypothesis testing53; ****, P < 0.00005. P values: RSC, P < 10−15; ±SWI/SNF, P < 10−15; ±RSC and SWI/SNF, P < 10−15. e, The multiplicative model for dynamic epistasis analysis was used to assess the effect of double perturbations. The expected effect of a double perturbation for independent processes (grey shaded area) is the product of the effect of the individual perturbations (fA and fB). If the observed effect (fA&B) is smaller than this expected effect, the perturbations are in the same pathway or have opposing functions. If the observed effect is larger, the processes are redundant. f, The increase in GAL10 induction time when simultaneously depleting RSC and SWI/SNF was larger than expected, based on their individual depletions. Gray bar, expected effect based on dynamic epistasis analysis. g, The increase in time between GAL10 transcriptional bursts in the RSC and SWI/SNF double depletion was larger than expected based on their individual depletions. Gray bar, expected effect based on dynamic epistasis analysis. Data in e, f and g are presented as the fractional change based on mean values ± s.d. based on 1,000 bootstrap repeats.

