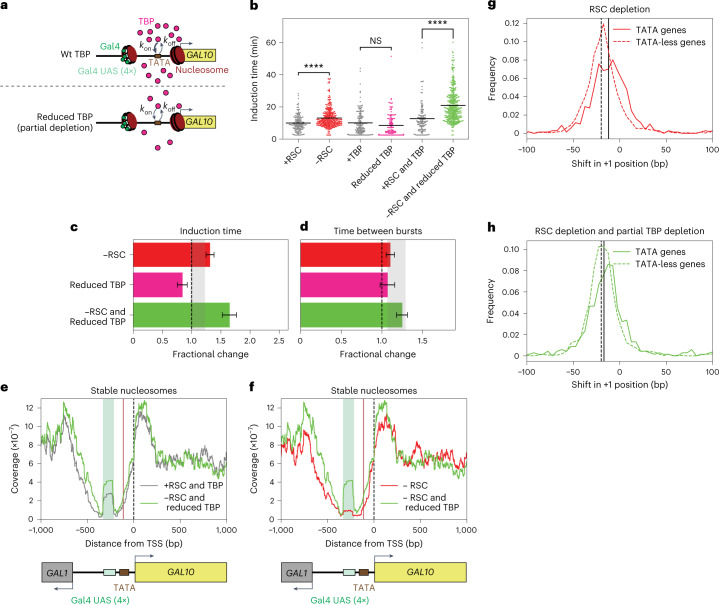
Fig. 4. The nucleosomes at the TATA and TSS are redundantly displaced by RSC and TBP to regulate the first burst of GAL10 transcription.
a, Schematic showing a reduced TBP on-rate after the addition of rapamycin in a diploid yeast strain where one of the two copies of TBP was depleted by anchor-away. b, GAL10 induction time increased upon RSC depletion, did not change upon partial TBP depletion and increased more in simultaneous RSC and partial TBP depletion. Significance determined by two-sided bootstrap hypothesis testing53; NS, not significant; ****, P < 0.00005. P values: ±RSC, P < 10−15; +TBP versus partial TBP 0.092; +RSC and TBP versus −RSC and partial TBP, P < 10−15. c, The increase in GAL10 induction time when simultaneously depleting RSC and partial TBP was larger than expected based on their individual depletions. Gray bar, expected effect based on dynamic epistasis analysis. d, The time between the consecutive bursts of GAL10 transcription increased as expected in the double depletion of RSC and partial TBP. Gray bar, expected effect based on dynamic epistasis analysis. Data in c and d are presented as the fractional change based on mean values ± s.d. based on 1,000 bootstrap repeats. e, MNase-seq analysis of stable nucleosomes in the GAL10 promoter region showed increased coverage around the TSS and TATA when RSC and partial TBP were depleted. f, MNase-seq analysis of stable nucleosomes in the GAL10 promoter region showed higher coverage around the TATA and TSS when depleting RSC and partial TBP than when depleting only RSC. g, Histogram of shift in +1 nucleosome upon depletion of RSC for both TATA genes and TATA-mismatch genes, showing that TATA-mismatch genes showed a larger shift in the +1 nucleosome than TATA genes. h, Histogram of shift in +1 nucleosome upon simultaneous depletion of RSC and partial TBP for both TATA genes and TATA-mismatch genes. Solid and dotted vertical lines in g and h indicate the median shift in the +1 nucleosome position of the TATA and TATA-less genes, respectively. Plots in e–h show one representative replicate out of two experiments.

