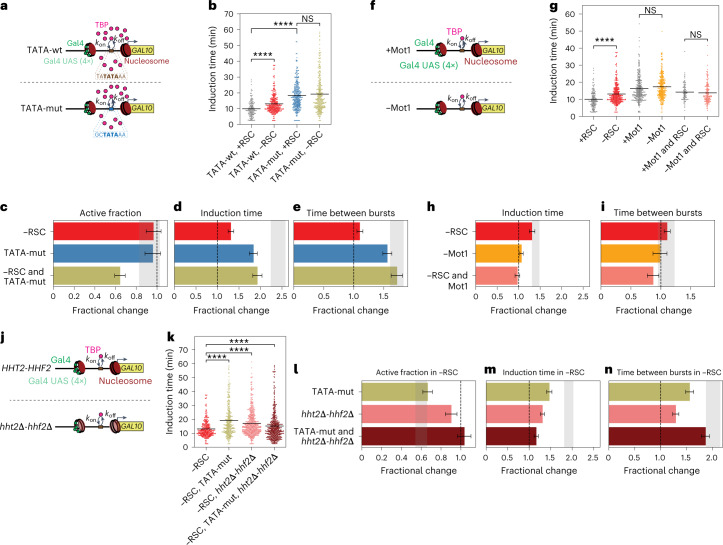
Fig. 5. Competition between TATA nucleosome and TBP depends on TBP residence time.
a, Schematic showing expected reduced TBP residence time upon mutating TATA (TATA-mut). b, GAL10 induction time increased upon RSC depletion in TATA-wt, but not in TATA-mut cells. P values: TATA-wt, ±RSC, P < 10−15; +RSC, TATA-wt versus TATA-mut, P < 10−15; TATA-mut, ±RSC, P = 0.264. c, Upon RSC depletion in TATA-mut, a fraction of cells did not activate GAL10 transcription. d, TATA-mut increased GAL10 induction time, with no additional effect upon RSC depletion, resulting in a smaller-than-expected effect based on individual perturbations. e, The effect on the time between consecutive bursts of GAL10 transcription was as expected based on individual perturbations. f, Schematic showing increased TBP residence time at the TATA upon Mot1 depletion. g, GAL10 induction time increased upon depletion of RSC but not upon Mot1 or RSC and Mot1 depletion. P values: ±RSC, P < 10−15; ±Mot1, P = 0.096; ±RSC and Mot1, P = 0.6. h, Smaller-than-expected effect of RSC and Mot1 depletion; Mot1 rescued the effect of RSC depletion. i, The effect on the time between consecutive bursts of GAL10 transcription was as expected based on individual perturbations. j, Schematic showing reduced histone levels upon hht2Δ-hhf2Δ. k, In −RSC, GAL10 induction time is increased upon TATA-mut or upon hht2Δ-hhf2Δ, which is partially rescued by their combination. P values: −RSC versus −RSC and TATA-mut, P < 10−15; −RSC versus −RSC and hht2Δ-hhf2Δ, P < 10−15; −RSC versus −RSC and TATA-mut and hht2Δ-hhf2Δ, P < 10−15. l, The inactive population in TATA-mut in −RSC is rescued by additional hht2Δ-hhf2Δ. m, TATA-mut in −RSC increased induction time, but this was rescued by additional hht2Δ-hhf2Δ. n, The effect on the time between consecutive bursts of GAL10 transcription was as expected based on individual perturbations. c–e, h–i and l–n, Change in active fraction is the fractional change based on number of active and inactive cells ± propagated statistical errors in these numbers. Change in other parameters is fractional change based on mean values ± s.d. based on 1,000 bootstrap repeats. Gray bar, expected effect based on dynamic epistasis analysis. l–n, Fractional changes are calculated relative to −RSC cells. b, g and k, Significance determined by bootstrap two-sided hypothesis testing53; NS, not significant; ****, P < 0.00005.

