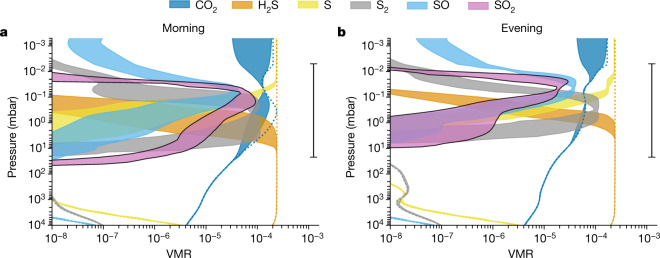
Fig. 1. Simulated vertical distribution of sulfur species and CO2.
a,b, The colour-shaded areas indicate the span (enclosed by the maximum and minimum values) of VMRs of CO2 (blue), SO2 (pink with black borders) and other key sulfur species (H2S, orange; S, yellow; S2, grey; SO, light blue) computed by an ensemble of photochemical models (ARGO, ATMO, KINETICS and VULCAN) for the morning (a) and evening (b) terminators. The thermochemical equilibrium VMRs are indicated by the dotted lines, with SO2 not within the x-axis range owing to its very low abundance in thermochemical equilibrium. The range bar on the right represents the main pressure ranges of the atmosphere investigated by JWST NIRSpec spectroscopy. Photochemistry produces SO2 and other sulfur species above the 1-mbar level with abundances several orders of magnitude greater than those predicted by thermochemical equilibrium.

