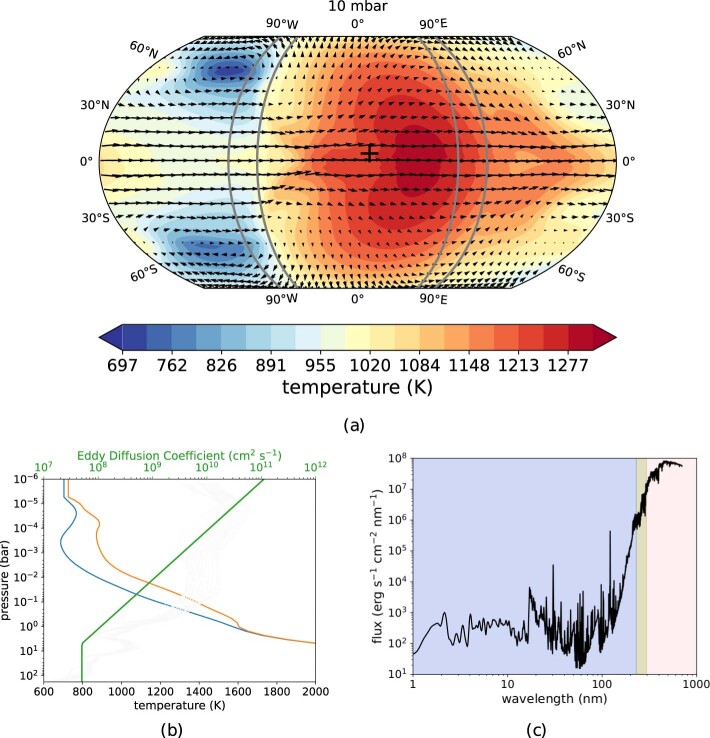
Extended Data Fig. 2. The temperature–wind map of the WASP-39b Exo-FMS GCM and input for 1D photochemical models.
a, The colour scale represents temperature across the planet and arrows denote the wind direction and magnitude at 10 mbar. The ±10° longitudinal regions with respect to the morning and evening terminators are indicated with solid grey lines. The ‘+’ symbol denotes the sub-stellar point. b, 1D temperature–pressure profiles adopted from the morning and evening terminators averaging all latitudes and ±10° longitudes (regions enclosed by grey lines in a) and the Kzz profile (equation (2) and held constant below the 5-bar level) overlaying the root-mean-squared vertical wind multiplied by 0.1 scale height from the GCM (grey). The temperatures are kept isothermal from those at the top boundary of the GCM around 5 × 10⁻⁵ bar when extending to lower pressures (about 10−8 bar) for photochemical models. c, Input WASP-39 stellar flux at the surface of the star. The pink-shaded region indicates the optical wavelength range at which the stellar spectrum is directly measured, whereas the blue-shaded and green-shaded regions are those constructed from the Sun and HD 203244, respectively.

