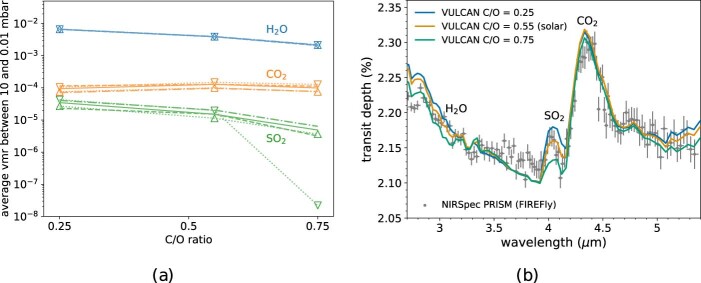
Extended Data Fig. 5. The C/O trends and synthetic spectra.
Same as Fig. 4 but as a function of C/O ratio at 10× solar metallicity. a, The averaged VMR of H2O, CO2 and SO2 between 10 and 0.01 mbar as a function of C/O ratio, in which the solar C/O is 0.55. The nominal model is shown by solid lines, whereas the eddy diffusion coefficient (Kzz) scaled by 0.1 and 10 are shown by dashed and dashed-dotted lines, respectively. The models for which the whole temperature increased and decreased by 50 K are indicated by the upward-facing and downward-facing triangles connected by dotted lines, respectively. b, The morning and evening terminator-averaged theoretical transmission spectra with different C/O ratios compared with the NIRSpec PRISM observation. The error bars show 1σ standard deviations.

