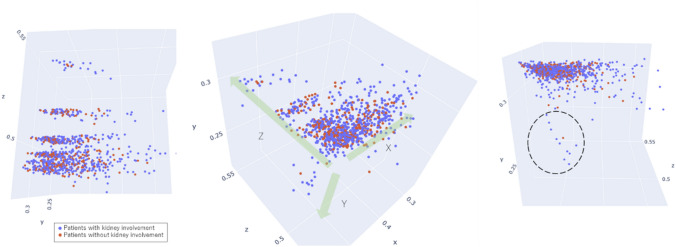
Fig. 2.
Scatter diagram of SLE patients in a feature space. A feature space obtained by machine learning is shown in a three-dimensional space and is viewed from three directions. Each dot on the scatter diagram indicates one patient. The coordinate axes x, y, and z were automatically defined by a learning model. In addition to these coordinate axes, we also defined feature vectors (indicated in green) as X, Y and Z. The feature vectors X and Y were obtained by converting the numbers of the coordinate axes x and y to the opposite signs (positive to negative, and negative to positive). The positive and negative numbers of feature vector Z correspond to those of the coordinate axis z. In the right diagram, patients with extremely high anti-dsDNA antibody titers (≥ 500, n = 49) had relatively low values on the y-axis (in the dashed circle)

