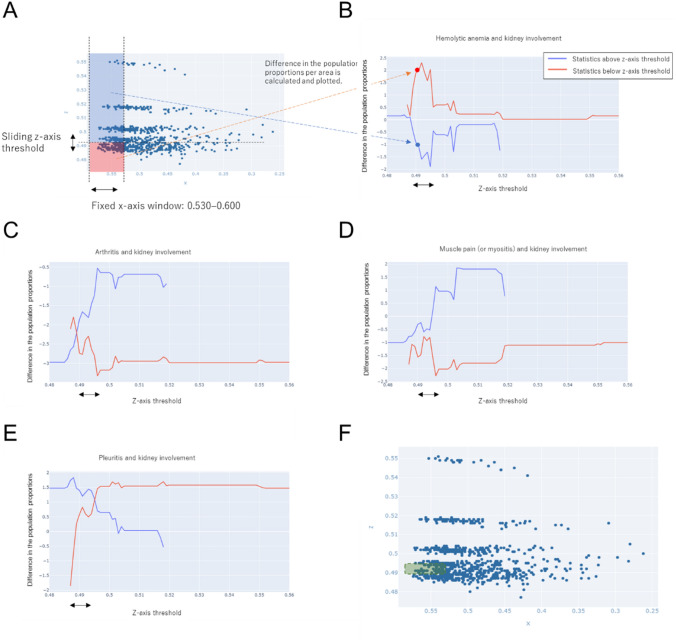
Fig. 6.
Correlation between the presence or absence of kidney involvement and that of arthritis, myalgia (myositis), or pleurisy. A Methods for setting areas and for calculating statistics. (Left) By fixing the thresholds on the x-axis and sliding the window along the z-axis, two areas were determined (red and blue). (Right) The statistics of these areas were calculated and plotted on the vertical axis, and the position of the window was indicated on the horizontal (z) axis to visualize their changes Statistics in the red area (left) correspond to the dot on the red line (right), and those in the blue area (left) correspond to the dot on the blue line (right). B–E The z-axis threshold was slid. Correlation between kidney involvement and B hemolytic anemia, C non-destructive arthritis (two or more lesions), D myalgia (myositis), or E pleurisy. F An area defined by an x-axis value of 0.530 or higher and a z-axis value of 0.490–0.495 represents patients with distinct features (green area in the diagram)

